概述
该策略结合了布林带(BB)和典型价格量值均线(VWAP)两个指标来制定买入和卖出决策。它可以发现短期价格异常然后进行交易,适合短线交易。
策略原理
该策略主要根据以下几条规则进行买入和卖出:
快速EMA线高于慢速EMA线作为判断趋势的先决条件
当收盘价高于VWAP时判断为价格上涨并买入
如果之前10根K线有一根收盘价低于布林下轨则判断为价格异常买入
当收盘价高于布林上轨时判断价格已经反转并卖出
具体来说,策略先判断50日EMA高于200日EMA,使用快慢EMA判断大趋势。然后再结合VWAP判断价格在短期内是否处于上涨趋势。最后利用布林带判断价格是否出现了短期的异常下跌作为entry机会。
exit规则比较简单,就是当价格高于布林带上轨的时候判断价格已经产生反转并退出。
优势分析
该策略结合了多种指标判断价格的异常,可以增加entry信号的效力。使用EMA判断大趋势可以避免逆势操作。结合VWAP可以捕捉短期价格上涨机会。利用布林带判断价格异常可以精准找到短线交易时机。
风险分析
- EMA判断大趋势判断不准导致逆势操作大盘
- VWAP指标应用于小时级或者日内数据效果最好,如果用于日线数据效果会打折扣
- 布林带参数设置不当,上下轨限制过宽或者过窄都会导致信号错失
针对这些风险,可以适当调整EMA周期参数或者尝试其他大趋势判断指标。VWAP参数应用于日内数据或者调整为其他短线指标。调整布林带参数寻找最佳幅度。
优化方向
- 尝试其他指标判断大趋势,比如MACD
- 优化EMA和布林带参数找到最佳配置
- 增加止损机制
- 结合其他指标过滤假 Signals
- 测试不同的品种和周期数据
总结
该策略结合布林带和VWAP两个指标,判断短期价格异常作为 entry 时机。使用 EMA 判断大趋势避免逆势操作。可以快速发现短线价格趋势机会。适用于日内和短线交易。通过参数优化和更新更多判断指标可以进一步增强策略稳定性和盈利能力。
策略源码
/*backtest
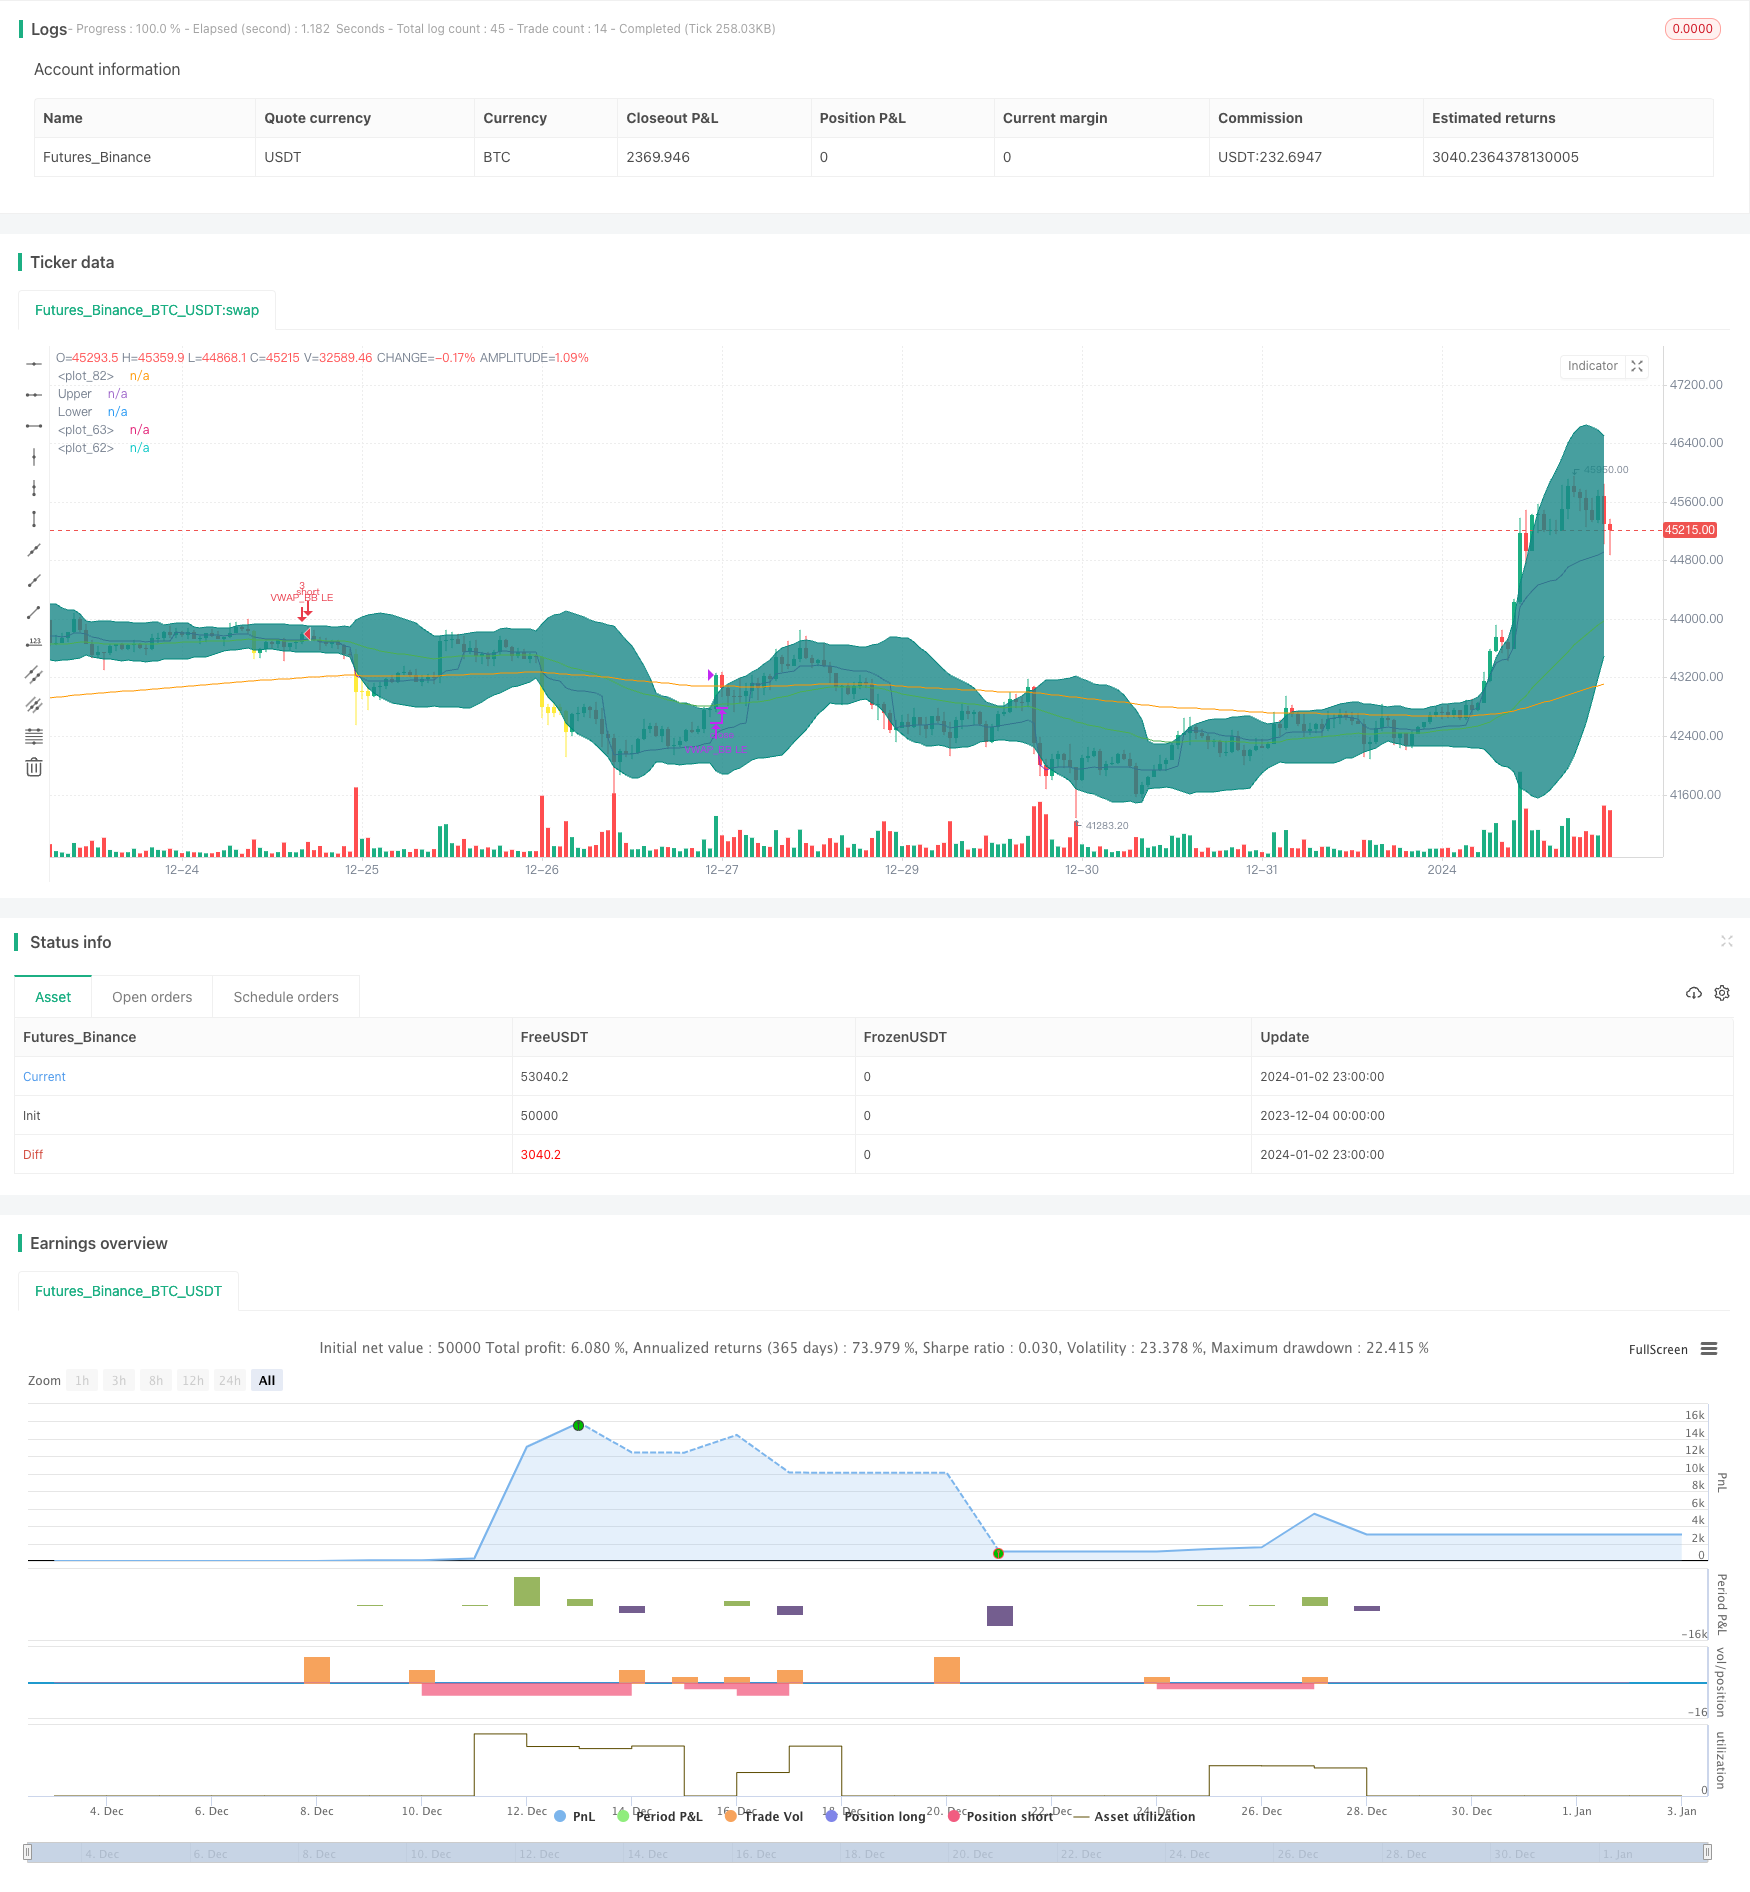
start: 2023-12-04 00:00:00
end: 2024-01-03 00:00:00
period: 1h
basePeriod: 15m
exchanges: [{"eid":"Futures_Binance","currency":"BTC_USDT"}]
*/
// This source code is subject to the terms of the Mozilla Public License 2.0 at https://mozilla.org/MPL/2.0/
// © mohanee
//@version=4
strategy(title="VWAP and BB strategy [EEMANI]", overlay=true,pyramiding=2, default_qty_value=3, default_qty_type=strategy.fixed, initial_capital=10000, currency=currency.USD)
//This strategy combines VWAP and BB indicators
//BUY RULE
//1. EMA50 > EMA 200
//2. if current close > vwap session value
//3. check if price dipped BB lower band for any of last 10 candles
//EXIT RULE
//1. price closes above BB upper band
//STOP LOSS EXIT
//1. As configured --- default is set to 5%
is_price_dipped_bb(pds,source1) =>
t_bbDipped=false
for i=1 to pds
t_bbDipped:= (t_bbDipped or close[i]<source1) ? true : false
if t_bbDipped==true
break
else
continue
t_bbDipped
// variables BEGIN
shortEMA = input(50, title="fast EMA", minval=1)
longEMA = input(200, title="slow EMA", minval=1)
//BB
smaLength = input(20, title="BB SMA Length", minval=1)
bbsrc = input(close, title="BB Source")
//addOnDivergence = input(true,title="Add to existing on Divergence")
//exitOption = input(title="exit on RSI or BB", type=input.string, options=["RSI", "BB"], defval="BB")
//bbSource = input(title="BB source", type=input.string, options=["close", "vwap"], defval="close")
//vwap_res = input(title="VWAP Resolution", type=input.resolution, defval="session")
stopLoss = input(title="Stop Loss%", defval=5, minval=1)
//variables END
longEMAval= ema(close, longEMA)
shortEMAval= ema(close, shortEMA)
vwapVal=vwap(close)
// Drawings
//plot emas
plot(longEMAval, color = color.orange, linewidth = 1, transp=0)
plot(shortEMAval, color = color.green, linewidth = 1, transp=0)
//bollinger calculation
mult = input(2.0, minval=0.001, maxval=50, title="StdDev")
basis = sma(bbsrc, smaLength)
dev = mult * stdev(bbsrc, smaLength)
upperBand = basis + dev
lowerBand = basis - dev
offset = input(0, "Offset", type = input.integer, minval = -500, maxval = 500)
//bollinger calculation
//plot bb
//plot(basis, "Basis", color=#872323, offset = offset)
p1 = plot(upperBand, "Upper", color=color.teal, offset = offset)
p2 = plot(lowerBand, "Lower", color=color.teal, offset = offset)
fill(p1, p2, title = "Background", color=#198787, transp=95)
plot(vwapVal, color = color.purple, linewidth = 1, transp=0)
// Colour background
barcolor(shortEMAval>longEMAval and close<=lowerBand ? color.yellow: na)
//longCondition= shortEMAval > longEMAval and close>open and close>vwapVal
longCondition= shortEMAval >= longEMAval and close>=vwapVal and close>open // close>vwapVal and
//Entry
strategy.entry(id="VWAP_BB LE", comment="VB LE" , long=true, when= longCondition and is_price_dipped_bb(10,lowerBand) ) //and strategy.position_size<1
//add to the existing position
//strategy.entry(id="VWAP_RSI LE", comment="VR LE Add" , long=true, when= addOnDivergence==true and strategy.position_size>=1 and close<strategy.position_avg_price and (close<lowerBand or low<lowerBand) and rsiVal>rsi_buy_line)
barcolor(strategy.position_size>=1 ? color.blue: na)
strategy.close(id="VWAP_BB LE", comment="TP Exit VB LE", when=crossover(close,upperBand) )
//stoploss
stopLossVal = strategy.position_avg_price * (1-(stopLoss*0.01) )
strategy.close(id="VB LE", comment="SL Exit", when= close < stopLossVal)