Camarilla Pivot Breakout Strategy

Overview
The Camarilla Pivot Breakout Strategy is a quantitative trading strategy that utilizes Camarilla pivot levels for entries and exits. This strategy draws on traditional technical analysis support and resistance theories, combines Camarilla mathematical formulas to calculate pivot points at different timeframes, and sets breakouts of these key levels as conditions for trade openings and closings, in order to achieve excess returns.
Strategy Logic
The core logic of this strategy is: calculating the H4 and L4, two key support and resistance levels, from the Camarilla formula at the daily timeframe; generating trading signals when price breaks these two levels.
Specifically, the strategy first calculates the midpoint of highest, lowest and closing prices of the current bar as the pivot point. Then it calculates the price range. Based on the range, various Camarilla levels can be plotted, including H4, H3, H2, H1 and L1, L2, L3, L4. Among them, H4 is the first resistance and L4 is the first support.
For trade signals, if the closing price breaks above H4 level, it triggers a long signal; if closing price breaks below L4, it triggers a short signal. By capturing breakouts of key S/R levels, the strategy judges the direction and momentum of the trend, generating trade signals.
So the main logic is: using Camarilla level breakouts to determine market structure and obtain trade signals.
Advantage Analysis
This Camarilla breakout strategy has several key strengths:
- Based on proven traditional technical theories, stable backtests
Camarilla analysis uses classic support/resistance concepts. Such theories stood the test of time and ensure strategy robustness across products and timeframes.
- Simple parameters, easy execution
Comparing to machine learning models, Camarilla rules are simple with few tunable metrics, easy to understand and execute in live trading, especially for beginners.
- Clear breakout signals, simple coding
Monitoring H4/L4 breakouts directly translates to trade entries. The strategy signal is crisp and code is simple. This allows quick prototyping from ideas to live trading.
- Applicable for high and low frequency trading
Camarilla strategy works for high frequency (second, minute bars) and low frequency (daily, weekly) trading. This versatility is a major plus.
Risk Analysis
However, such simple breakout strategy has some inherent weaknesses:
- Risk of false breakout
Price may fail to trend post breakout and reverse instead. Not cutting loss timely could lead to large drawdowns. We need safeguards against false signals.
- Missing some breakout opportunities
Monitoring only closing prices may cause missing potential breakouts during earlier bar periods. Optimization is needed to improve signal accuracy.
- Profit potential could be limited
Comparing to more sophisticated models, sole reliance on Camarilla may limit profit margin and amplitude. We can mitigate through position sizing and leverage management.
Therefore, risk management via stop loss, optimizing entry logic, and adjusting position sizes are necessary to ensure robustness of such simple breakout method.
Optimization Directions
To further optimize this Camarilla breakout strategy, we can focus on the following:
- Incorporate additional metrics to detect true breakout
Combining volume, moving averages etc. to gauge breakout authenticity and avoid false signals.
- Optimize breakout logic
Like relaxing breakout magnitude through backtests to find sweet spots. Or adding more rules based on seasonalities.
- Optimize stop loss strategies
Tighten stop loss ranges while avoiding premature stops. Or alternative strats like trailing stop loss.
- Dynamically adjust position sizes and leverage
Adaptive tuning of positions and leverage parameters to suit evolving market regimes.
- Incorporate more advanced machine learning
Leverage LSTM, RNN models to predict breakout probabilities and enhance intelligence.
Summary
The Camarilla Pivot Breakout Strategy is a simple and direct quantitative trading strategy that is easy to implement. It utilizes mature technical analysis tools and generates trade signals by capturing breaks of key support and resistance levels. This type of strategy has the advantage of stability and reliability. It is also relatively simple for real-world execution. Of course, further enhancements around stop loss, parameter tuning, risk control etc. are necessary to achieve higher efficiency.
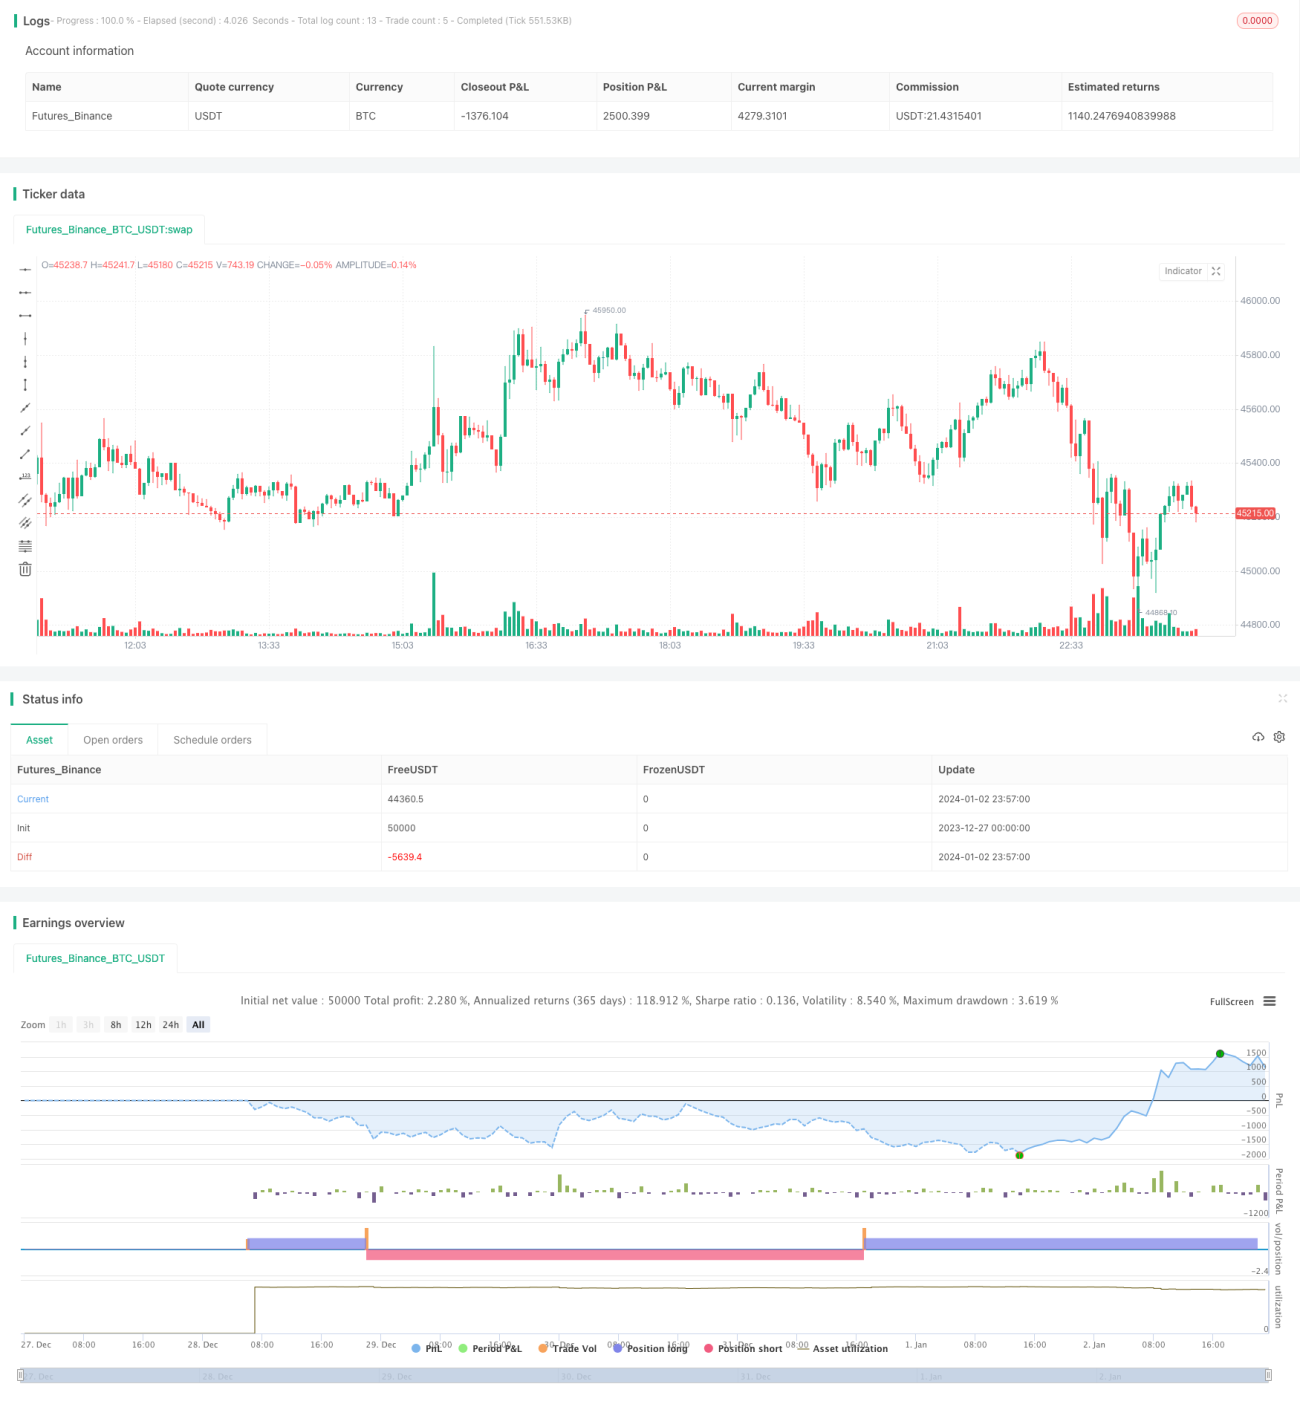
/*backtest
start: 2023-12-27 00:00:00
end: 2024-01-03 00:00:00
period: 5m
basePeriod: 1m
exchanges: [{"eid":"Futures_Binance","currency":"BTC_USDT"}]
*/

//@version=2
//Created by CristianD
strategy(title="CamarillaStrategy", shorttitle="CD_Camarilla_Strategy", overlay=true)
//sd = input(true, title="Show Daily Pivots?")- 1