概述
该策略采用动向指标(DMI)和Hull移动平均线(HMA)的组合,利用DMI判断市场方向,HMA确认趋势力度,实现无风险管理的交易。
策略原理
计算真实波幅(True Range)、多头动向指标(DIPlus)、空头动向指标(DIMinus)和平均方向指数(ADX)。
计算快速Hull平均线(fasthull)和慢速Hull平均线(slowhull)。
触发做多条件:DIPlus上穿DIMinus且fasthull上穿slowhull。
触发做空条件:DIMinus下穿DIPlus且fasthull下穿slowhull。
满足做多做空条件后分别发出做多和做空信号。
优势分析
该策略结合趋势判断指标DMI和Hull均线的双重确认,可以有效识别市场趋势方向,避免多头市和空头市的反复。无风险管理降低了交易频率,从长期来看整体盈利水平良好。
风险分析
该策略最大的风险在于无止损设置,行情出现剧烈波动时无法有效控制亏损。此外,参数优化空间有限,针对性不强也是一大缺点。
可以通过加入移动止损、优化参数组合等手段来减少风险。
优化方向
加入ATR止损,利用真实波幅trailing止损。
优化Hull周期参数,找到最佳组合。
动态调整做多做空的参数门槛。
加入量能指标等过滤器,确保趋势持续。
总结
DMI和HMA的组合策略,判断精准,简单有效,适合中长线操作。加入适当的止损和参数优化后,可以成为非常出色的趋势追踪系统。
策略源码
/*backtest
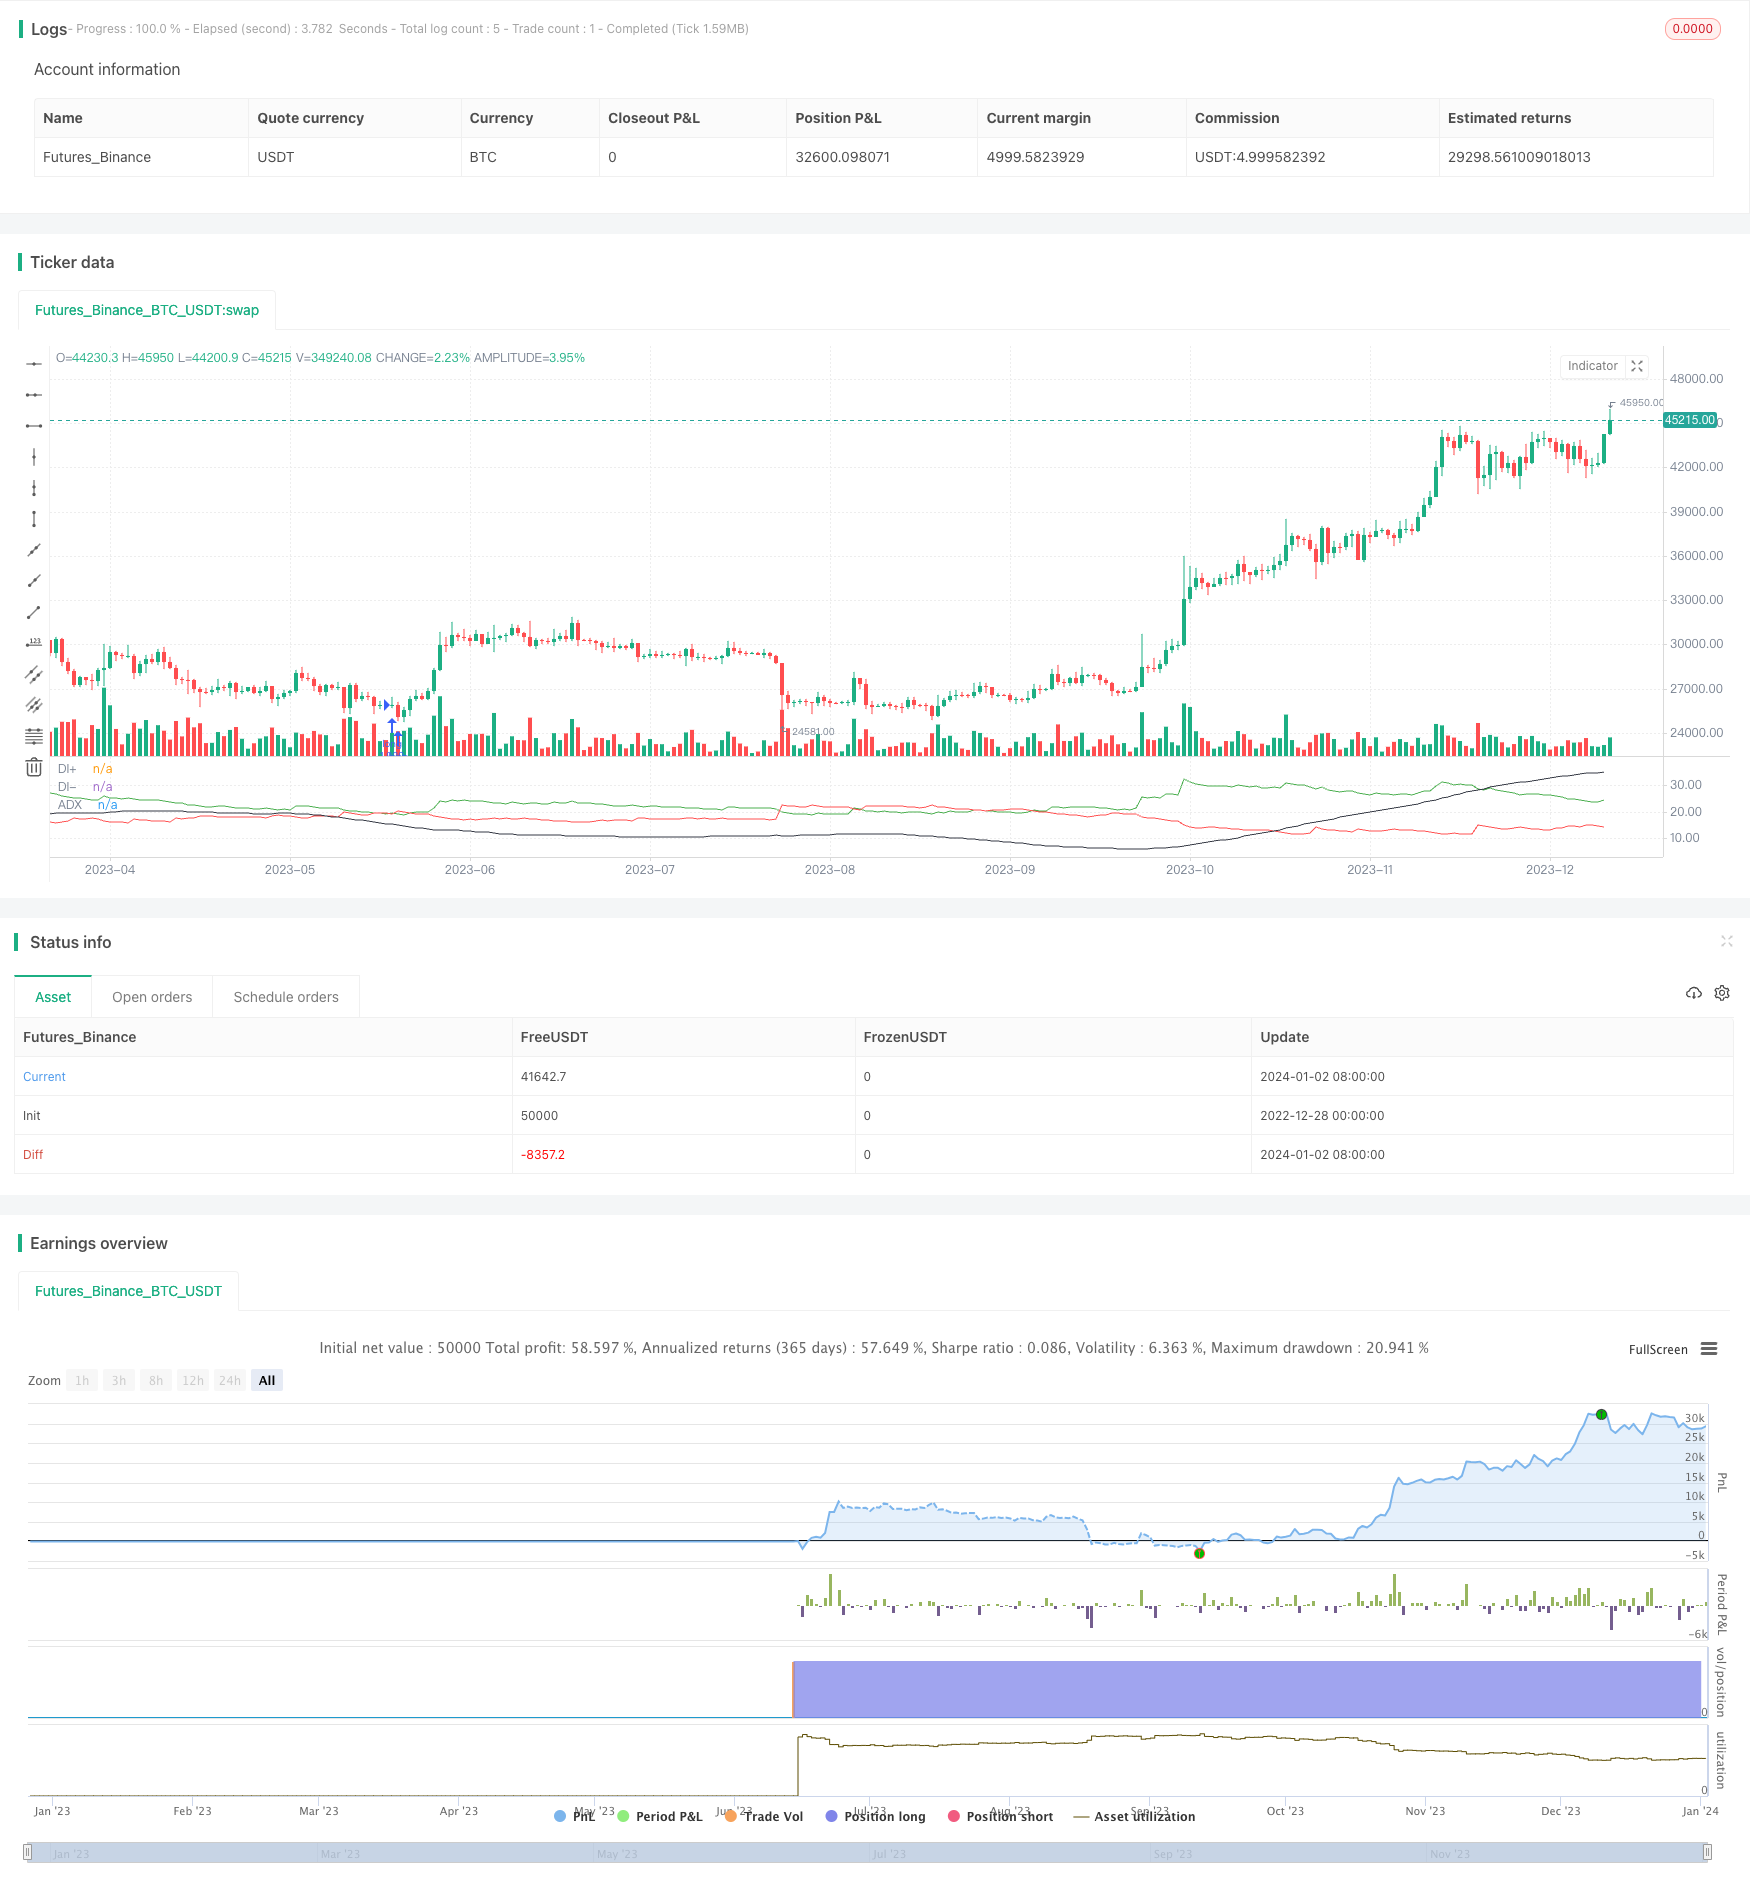
start: 2022-12-28 00:00:00
end: 2024-01-03 00:00:00
period: 1d
basePeriod: 1h
exchanges: [{"eid":"Futures_Binance","currency":"BTC_USDT"}]
*/
// This source code is subject to the terms of the Mozilla Public License 2.0 at https://mozilla.org/MPL/2.0/
// © Tuned_Official
//@version=4
strategy(title="DMI + HMA - No Risk Management", overlay = false, pyramiding=1, default_qty_type=strategy.percent_of_equity, default_qty_value=100, commission_type=strategy.commission.percent, commission_value=0.025)
//Inputs
hullLen1 = input(title="Hull 1 length", type=input.integer, defval=29)
hullLen2 = input(title="Hull 2 length", type=input.integer, defval=2)
len = input(title="Length for DI", type=input.integer, defval=76)
//Calculations
TrueRange = max(max(high-low, abs(high-nz(close[1]))), abs(low-nz(close[1])))
DirectionalMovementPlus = high-nz(high[1]) > nz(low[1])-low ? max(high-nz(high[1]), 0): 0
DirectionalMovementMinus = nz(low[1])-low > high-nz(high[1]) ? max(nz(low[1])-low, 0): 0
SmoothedTrueRange = 0.0
SmoothedTrueRange := nz(SmoothedTrueRange[1]) - (nz(SmoothedTrueRange[1])/len) + TrueRange
SmoothedDirectionalMovementPlus = 0.0
SmoothedDirectionalMovementPlus := nz(SmoothedDirectionalMovementPlus[1]) - (nz(SmoothedDirectionalMovementPlus[1])/len) + DirectionalMovementPlus
SmoothedDirectionalMovementMinus = 0.0
SmoothedDirectionalMovementMinus := nz(SmoothedDirectionalMovementMinus[1]) - (nz(SmoothedDirectionalMovementMinus[1])/len) + DirectionalMovementMinus
//Indicators
fasthull = hma(close, hullLen1)
slowhull = hma(close, hullLen2)
DIPlus = SmoothedDirectionalMovementPlus / SmoothedTrueRange * 100
DIMinus = SmoothedDirectionalMovementMinus / SmoothedTrueRange * 100
DX = abs(DIPlus-DIMinus) / (DIPlus+DIMinus)*100
ADX = sma(DX, len)
//Plots
plot(DIPlus, color=color.green, title="DI+")
plot(DIMinus, color=color.red, title="DI-")
plot(ADX, color=color.black, title="ADX")
//conditions
go_long = crossover(DIPlus, DIMinus) and fasthull > slowhull //crossover(fasthull, slowhull) and DIPlus > DIMinus
go_short = crossover(DIMinus, DIPlus) and fasthull < slowhull //crossunder(fasthull, slowhull) and DIMinus > DIPlus
//Entry
if strategy.position_size < 0 or strategy.position_size == 0
strategy.order("long", strategy.long, when=go_long)
if strategy.position_size > 0 or strategy.position_size == 0
strategy.order("Short", strategy.short, when=go_short)