概述
TrendSurfing策略是一个以双均线交叉为主要交易信号的趋势跟踪策略。它同时结合了三角形视觉指标、200日EMA、ROC指标和RSI指标来过滤噪音,在趋势转折点精确捕捉到新的趋势方向。这个策略适合中长线持仓,可在牛市中获得稳定增长。
策略原理
TrendSurfing策略主要基于快速移动平均线和慢速移动平均线的金叉死叉形成买入和卖出信号。当快速移动平均线上穿慢速移动平均线时产生买入信号;当快速移动平均线下穿慢速移动平均线时产生卖出信号。
此外,该策略还引入了多个辅助指标来过滤假信号或确定趋势质量。具体来说:
- ROC指标判断价格变化趋势和速度
- RSI指标判断是否处于超买超卖区域
- 200日EMA判断总体趋势方向
- 三角形视觉指标在图表上标记入场点
通过多指标综合判断,TrendSurfing策略能够在趋势转折点准确定位,跟踪中长线明确趋势,避免被市场噪音或短线调整误导。
优势分析
1. 捕捉中长线明确趋势
该策略通过均线交叉基本判断趋势转折点,结合200日EMA等指标过滤短线噪音,专注中长线趋势的把握。
2. 多指标组合确认高质量入场时机
除了均线交叉本身,该策略还引入ROC、RSI等指标,在趋势转折点避开震荡区间,确保入场质量。
3. 直观易读的三角形视觉指标
绿色向下三角形标记买入时机,红色向上三角形标记卖出时机,一目了然。
4. 可自定义参数满足不同需求
用户可自由调整均线参数、ROC长度、RSI长度等,契合自己的交易风格。
5. 兼顾止损止盈管理 该策略以ATR值乘以风险比例作为止损位和止盈位,可控制单笔交易风险。
风险分析
1. 存在漏单风险
任何以均线交叉为基础的策略,都会面临均线震荡时带来的一定漏单或止损风险。
2. 参数设置不当可能导致过度优化
用户要避免追求标准参数,而将指标数值设置得过分理想化。应该根据不同市场行情和品种进行参数测试。
3. 无法全面过滤市场系统性风险事件 极端行情下,如遭遇黑天鹅事件,仍有可能面临较大亏损。
优化方向
1. 测试并优化参数设定
必须对均线周期、ROC长度、RSI参数等进行回测和优化,使其更符合不同交易品种特点。
2. 测试并引入其他辅助指标
可继续测试其他指标如BOLL、KDJ等与均线交叉的组合效果。
3. 结合算法交易进行止盈止损优化
引入机器学习算法,让止损止盈更加智能化,适应动态变化的市场环境。
4. 探索与其他策略或者模型的组合
与基本面选股策略、统计套利策略、投资组合优化模型等进行组合,可进一步控制风险提高收益率。
总结
TrendSurfing策略是一个简单直接、风险可控的趋势跟踪策略。它围绕双均线交叉形成的交易信号展开,并用多种辅助指标进行过滤。该策略适用于中长线持仓,可稳定跟踪牛市趋势。我们会继续通过参数测试、指标扩展、风险控制等手段对该策略进行优化,使其在更广泛市场中获得更稳定的表现。
||
Overview
The TrendSurfing strategy is a trend tracking strategy based primarily on double moving average crossover signals. It also incorporates triangle visual indicators, 200-day EMA, ROC indicator and RSI indicator to filter out noise and accurately capture trend reversals. This strategy is suitable for medium-to-long-term holding and can achieve steady growth in a bull market.
Strategy Logic
The TrendSurfing strategy mainly relies on golden cross and death cross formed by fast moving average and slow moving average to generate buy and sell signals. When the fast MA crosses above the slow MA, a buy signal is generated. When the fast MA crosses below the slow MA, a sell signal is generated.
In addition, the strategy incorporates several auxiliary indicators to filter out false signals or determine trend quality, including:
- ROC indicator to determine price trend and momentum
- RSI oscillator to detect overbought/oversold levels
- 200-day EMA to determine overall trend direction
- Triangle visual indicators to mark entry points on chart
By comprehensively judging various indicators, the TrendSurfing strategy can accurately locate trend turning points and track definite medium-to-long term trends without being misguided by market noise or short-term corrections.
Advantage Analysis
1. Catch Medium-to-Long Term Trend
The strategy basically judges trend reversal based on MA crosses, and uses indicators like 200-day EMA to filter out short-term noise, with focus on medium-to-long term trend capture.
2. Multiple Indicators Ensure High Quality Entry
On top of MA crossover itself, the incorporation of ROC, RSI and other indicators enables avoidance of consolidation zones on reversal points and ensures quality entry.
3. Intuitive Triangle Visual Indicators
Green downward triangles indicate long entries, red upward triangles indicate short entries. Clean and straightforward.
4. Customizable Parameters for Different Needs
Users can freely adjust parameters like MA periods, ROC length, RSI length etc according to their own trading style.
5. Stop Loss and Take Profit Control
The strategy sets stop loss and take profit based on ATR value multiplied by risk percentage, enabling per trade risk control.
Risk Analysis
1. Risk of Missing Trades
Any MA crossover based strategy has inherent risk of missing trades or being stopped out when MA is oscillating.
2. Over-optimization from Improper Parameter Settings Users should avoid chasing hypothetically ideal parameter values. Parameters should be tested and adapted based on different market conditions and products.
3. Inability to Fully Filter Black Swan Events
Under extreme market conditions, strategies could still face large losses from market systemic risks.
Optimization Directions
1. Test and Optimize Parameter Values
Periods of MAs, length of ROC, values of RSI etc should go through rigorous backtesting and optimization to fit characteristics of different trading products.
2. Test and Incorporate Other Auxiliary Indicators
Continue testing combinations of other indicators like BOLL, KDJ etc with MA crosses for better performance.
3. Coordinate with Algorithmic Trading for Better Risk Control Introduce machine learning algorithms to enable more intelligent stop loss and take profit, adapting to dynamic market environments.
4. Explore Combinations with Other Strategies or Models
Combining with fundamentals-based stock picking strategies, statistical arbitrage strategies, portfolio optimization models etc could further enhance risk control and return.
Conclusion
The TrendSurfing strategy is a simple, straightforward trend tracking strategy with controllable risk. Trading signals are generated from MA crosses and filtered by multiple auxiliary indicators. It is suitable for medium-to-long term holding to steadily track bull market trends. We will continue optimizing this strategy through parameter testing, indicator expansion, risk control etc to achieve more reliable performance across diverse markets.
[/trans]
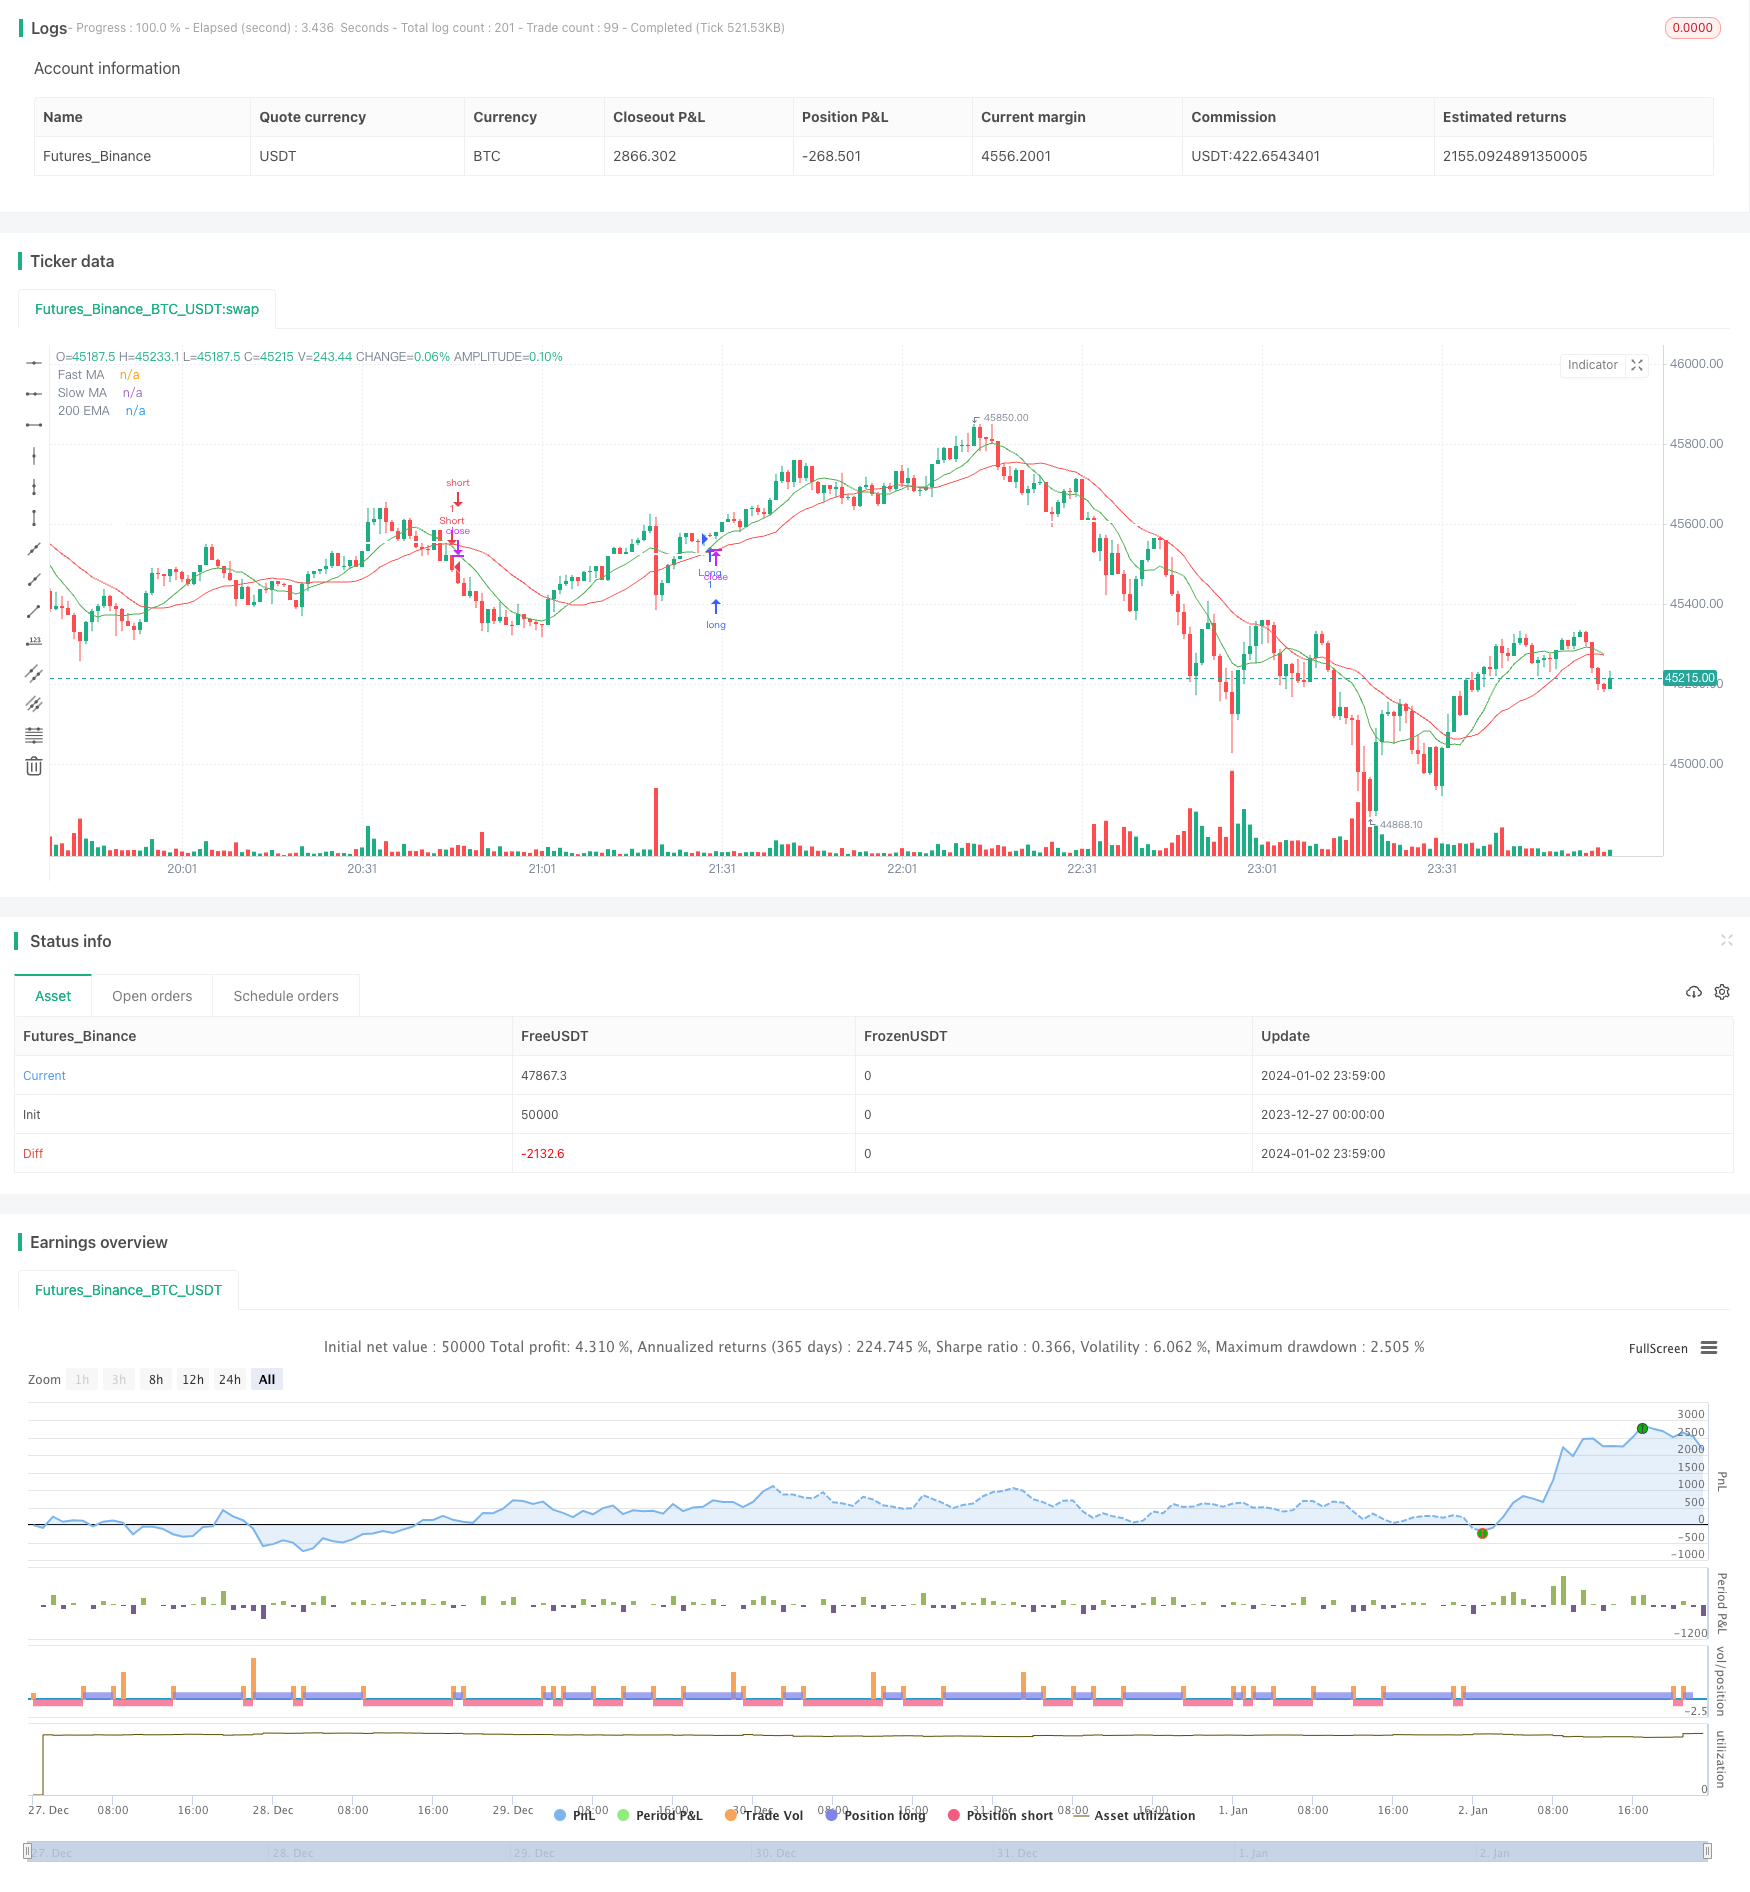
/*backtest
start: 2023-12-27 00:00:00
end: 2024-01-03 00:00:00
period: 1m
basePeriod: 1m
exchanges: [{"eid":"Futures_Binance","currency":"BTC_USDT"}]
*/

//@version=4
strategy("Moving Average Crossover with Triangles, 200 EMA, ROC, and RSI", overlay=true)

// Define input parameters
fast_length = input(9, title="Fast MA Length")
slow_length = input(21, title="Slow MA Length")
roc_length = input(14, title="ROC Length")
rsi_length = input(14, title="RSI Length")

// Calculate moving averages
fast_ma = sma(close, fast_length)
slow_ma = sma(close, slow_length)

// Plot moving averages
plot(fast_ma, color=color.green, title="Fast MA")
plot(slow_ma, color=color.red, title="Slow MA")

// Plot 200 EMA
ema_200 = ema(close, 200)
plot(ema_200, color=color.white, title="200 EMA", linewidth=2)

// Calculate Rate of Change (ROC)
roc = roc(close, roc_length)

// Calculate RSI
rsi = rsi(close, rsi_length)

// Define strategy entry and exit conditions
long_condition = crossover(fast_ma, slow_ma) and roc > 0 and close > ema_200 and rsi > 55
short_condition = crossunder(fast_ma, slow_ma) and roc < 0 and close < ema_200 and rsi < 45

// Execute strategy
strategy.entry("Long", strategy.long, when=long_condition)
strategy.entry("Short", strategy.short, when=short_condition)

// Define stop loss and take profit levels
risk_percent = input(1, title="Risk Percentage", minval=0.1, maxval=5, step=0.1) / 100
atr_value = atr(14)
stop_loss = close - atr_value * risk_percent
take_profit = close + atr_value * risk_percent

strategy.exit("Take Profit/Stop Loss", from_entry="Long", loss=stop_loss, profit=take_profit)
strategy.exit("Take Profit/Stop Loss", from_entry="Short", loss=stop_loss, profit=take_profit)

// Plot larger triangles on crossover and crossunder
plotshape(series=long_condition, title="Long Entry", color=color.green, style=shape.triangleup, location=location.belowbar, size=size.small)
plotshape(series=short_condition, title="Short Entry", color=color.red, style=shape.triangledown, location=location.abovebar, size=size.small)