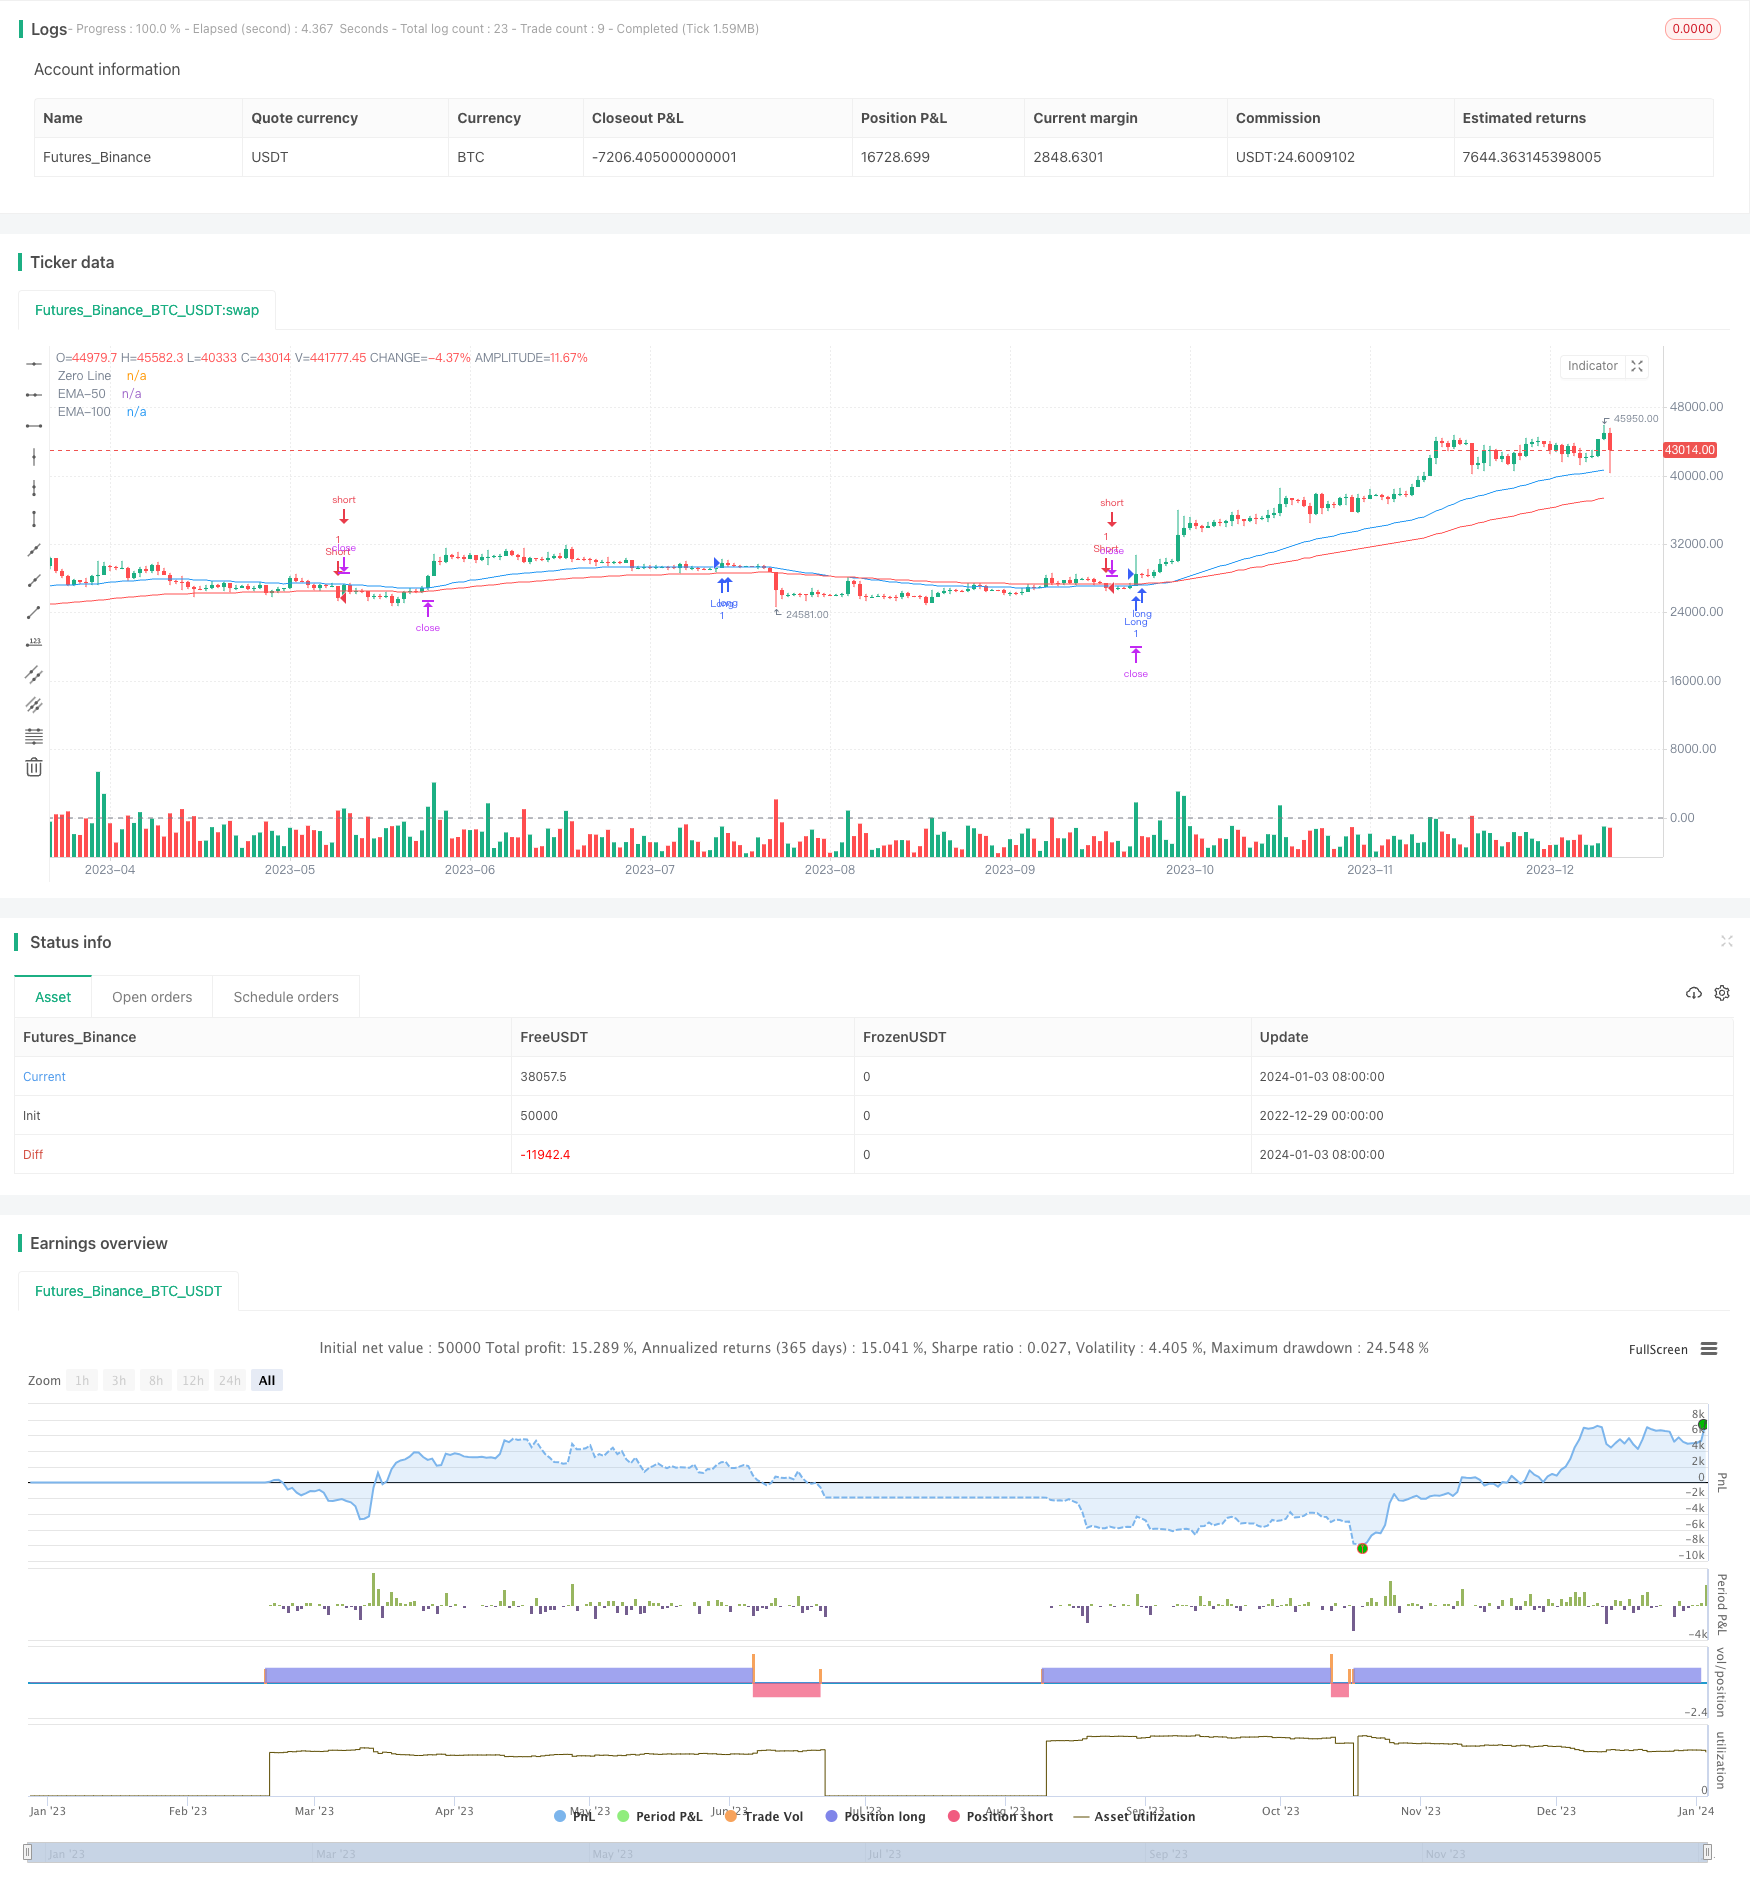
概述
该策略综合利用EMA均线和MACD指标在多时间框架下识别趋势信号,以捕捉中长线趋势。当短期趋势与中长期趋势方向一致时,采取趋势跟踪操作。同时,策略利用ATR指标设定止损止盈,对波动进行风险控制。
策略原理
策略以50日EMA线和100日EMA线判断中长期趋势方向。当短期趋势由MACD指标识别时,判断短期趋势方向与中长期趋势方向是否一致。如果一致,采取趋势跟踪操作。
具体来说,当MACD快线上穿慢线,并且 closes > 50日EMA 且 closes > 100日EMA时,做多;当MACD快线下穿慢线,并且 closes < 50日EMA 且 closes < 100日EMA时,做空。
此外,策略利用ATR指标计算波动范围,设定止损止盈价格。以close价格的一定倍数的ATR作为止损位,以close价格的一定倍数的ATR作为止盈位。
优势分析
- 结合EMA均线和MACD指标,可以在多时间框架下识别趋势信号,防止错失中长线趋势
- 利用ATR指标根据市场波动设定止损止盈位,可以有效控制风险
- 避免交易市场中性区域,减少不必要损失
风险分析
- EMA均线存在滞后性,可能错过转折点
- MACD指标存在多个时间周期,参数设置会影响结果
- ATR波动范围无法完全代表未来价格波动,无法完全规避风险
对策:
- 结合其他指标确认信号,规避EMA滞后问题
- 调整MACD参数,优化结果
- 合理设定ATR倍数,控制最大损失
优化方向
- 测试不同的EMA均线周期组合
- 优化MACD参数设置
- 利用机器学习方法自动寻找最优ATR止损止盈倍数
总结
该策略综合利用EMA、MACD和ATR等指标,实现多时间框架下的趋势跟踪操作。通过参数优化,有望获取较好的策略收益率。同时也需要防范指标滞后、参数调整及波动控制不当等风险,需要继续优化与提升。
策略源码
/*backtest
start: 2022-12-29 00:00:00
end: 2024-01-04 00:00:00
period: 1d
basePeriod: 1h
exchanges: [{"eid":"Futures_Binance","currency":"BTC_USDT"}]
*/

//@version=5
strategy("EMA-50, EMA-100, and MACD Strategy with ATR for Stop Loss/Profit", overlay=true)

// MACD hesaplama
fastLength = input(12, title="Fast Length")
slowLength = input(26, title="Slow Length")
signalLength = input(9, title="Signal Length")
[macdLine, signalLine, _] = ta.macd(close, fastLength, slowLength, signalLength)

// EMA-50 ve EMA-100 hesaplama
ema50 = ta.ema(close, 50)
ema100 = ta.ema(close, 100)

// ATR hesaplama
atrLength = input(14, title="ATR Length")
atrValue = ta.atr(atrLength)

// Take Profit ve Stop Loss çoklayıcıları
takeProfitMultiplier = input(3.0, title="Take Profit Multiplier") // TP, 3 katı ATR
stopLossMultiplier = input(1.0, title="Stop Loss Multiplier")

// Long Pozisyon Koşulları
longCondition = ta.crossover(macdLine, signalLine) and close > ema50 and close > ema100

// Short Pozisyon Koşulları
shortCondition = ta.crossunder(macdLine, signalLine) and close < ema50 and close < ema100

// Take Profit ve Stop Loss Seviyeleri
takeProfitLevel = close + takeProfitMultiplier * atrValue
stopLossLevel = close - stopLossMultiplier * atrValue

// Long Pozisyon İşlemleri
strategy.entry("Long", strategy.long, when=longCondition)
strategy.exit("Take Profit/Stop Loss", from_entry="Long", loss=stopLossLevel, profit=takeProfitLevel)

// Short Pozisyon İşlemleri
strategy.entry("Short", strategy.short, when=shortCondition)
strategy.exit("Take Profit/Stop Loss", from_entry="Short", loss=stopLossLevel, profit=takeProfitLevel)

// Grafikte Gösterme
plot(ema50, color=color.blue, title="EMA-50")
plot(ema100, color=color.red, title="EMA-100")
hline(0, "Zero Line", color=color.gray)