概述
本策略名称为“基于趋势追踪的动量突破策略”。该策略利用超级趋势指标判断当前趋势方向,并结合K线实体的方向进行趋势追踪,实现动量突破交易。
策略原理
该策略主要依靠超级趋势指标(SuperTrend)判断目前的趋势方向。超级趋势指标结合平均真实波幅(ATR)计算上轨和下轨,价格突破上轨时为看涨信号,价格跌破下轨时为看跌信号。
当超级趋势指标判断为上升趋势时,如果这根K线为红实体(收盘价低于开盘价),则做多;当超级趋势指标判断为下降趋势时,如果这根K线为绿实体(收盘价高于开盘价),则做空。这样就实现了趋势追踪下的动量突破交易。
优势分析
这种策略结合趋势判断和动量特征,能够有效过滤假突破,增强交易信号的有效性。此外,追踪趋势进行交易,避免了逆势操作,大大提高盈利概率。
优势总结如下: 1. 结合趋势判断和动量特征,过滤假突破 2. 追踪趋势实体方向,避免逆势交易 3. 盈利概率较高
风险分析
该策略主要存在以下几方面的风险:
- 超级趋势指标如何设定参数的问题。参数设置不当,可能导致指标判断失误,产生错误信号。
- 仅跟踪实体方向,无法判断实体强弱,可能存在亏损风险。
- 固定盈亏比无法动态调整,无法控制单笔亏损。
对策如下: 1. 对超级趋势指标参数进行优化,使指标判断更准确。 2. 结合交易量,资金流等指标判断实体的强弱。 3. 增加动态止损来控制单笔亏损。
优化方向
这种策略可以从以下几个方向进行优化:
- 结合更多技术指标进行信号过滤,如布林线,KDJ等,增强策略效果。
- 增加机器学习算法,实现参数的动态优化,使超级趋势指标更稳定。
- 加入止损机制,能够在亏损扩大前止损出场。
- 采用期货等具有双向交易特点的品种,充分利用看涨看跌双向操作机会。
总结
本策略总体来说非常适合中短期持仓。结合趋势判断和突破动量特征,能有效过滤噪声,提高交易胜率。同时该策略也存在一定的参数优化空间,通过进一步优化可以获得更好的策略效果。
策略源码
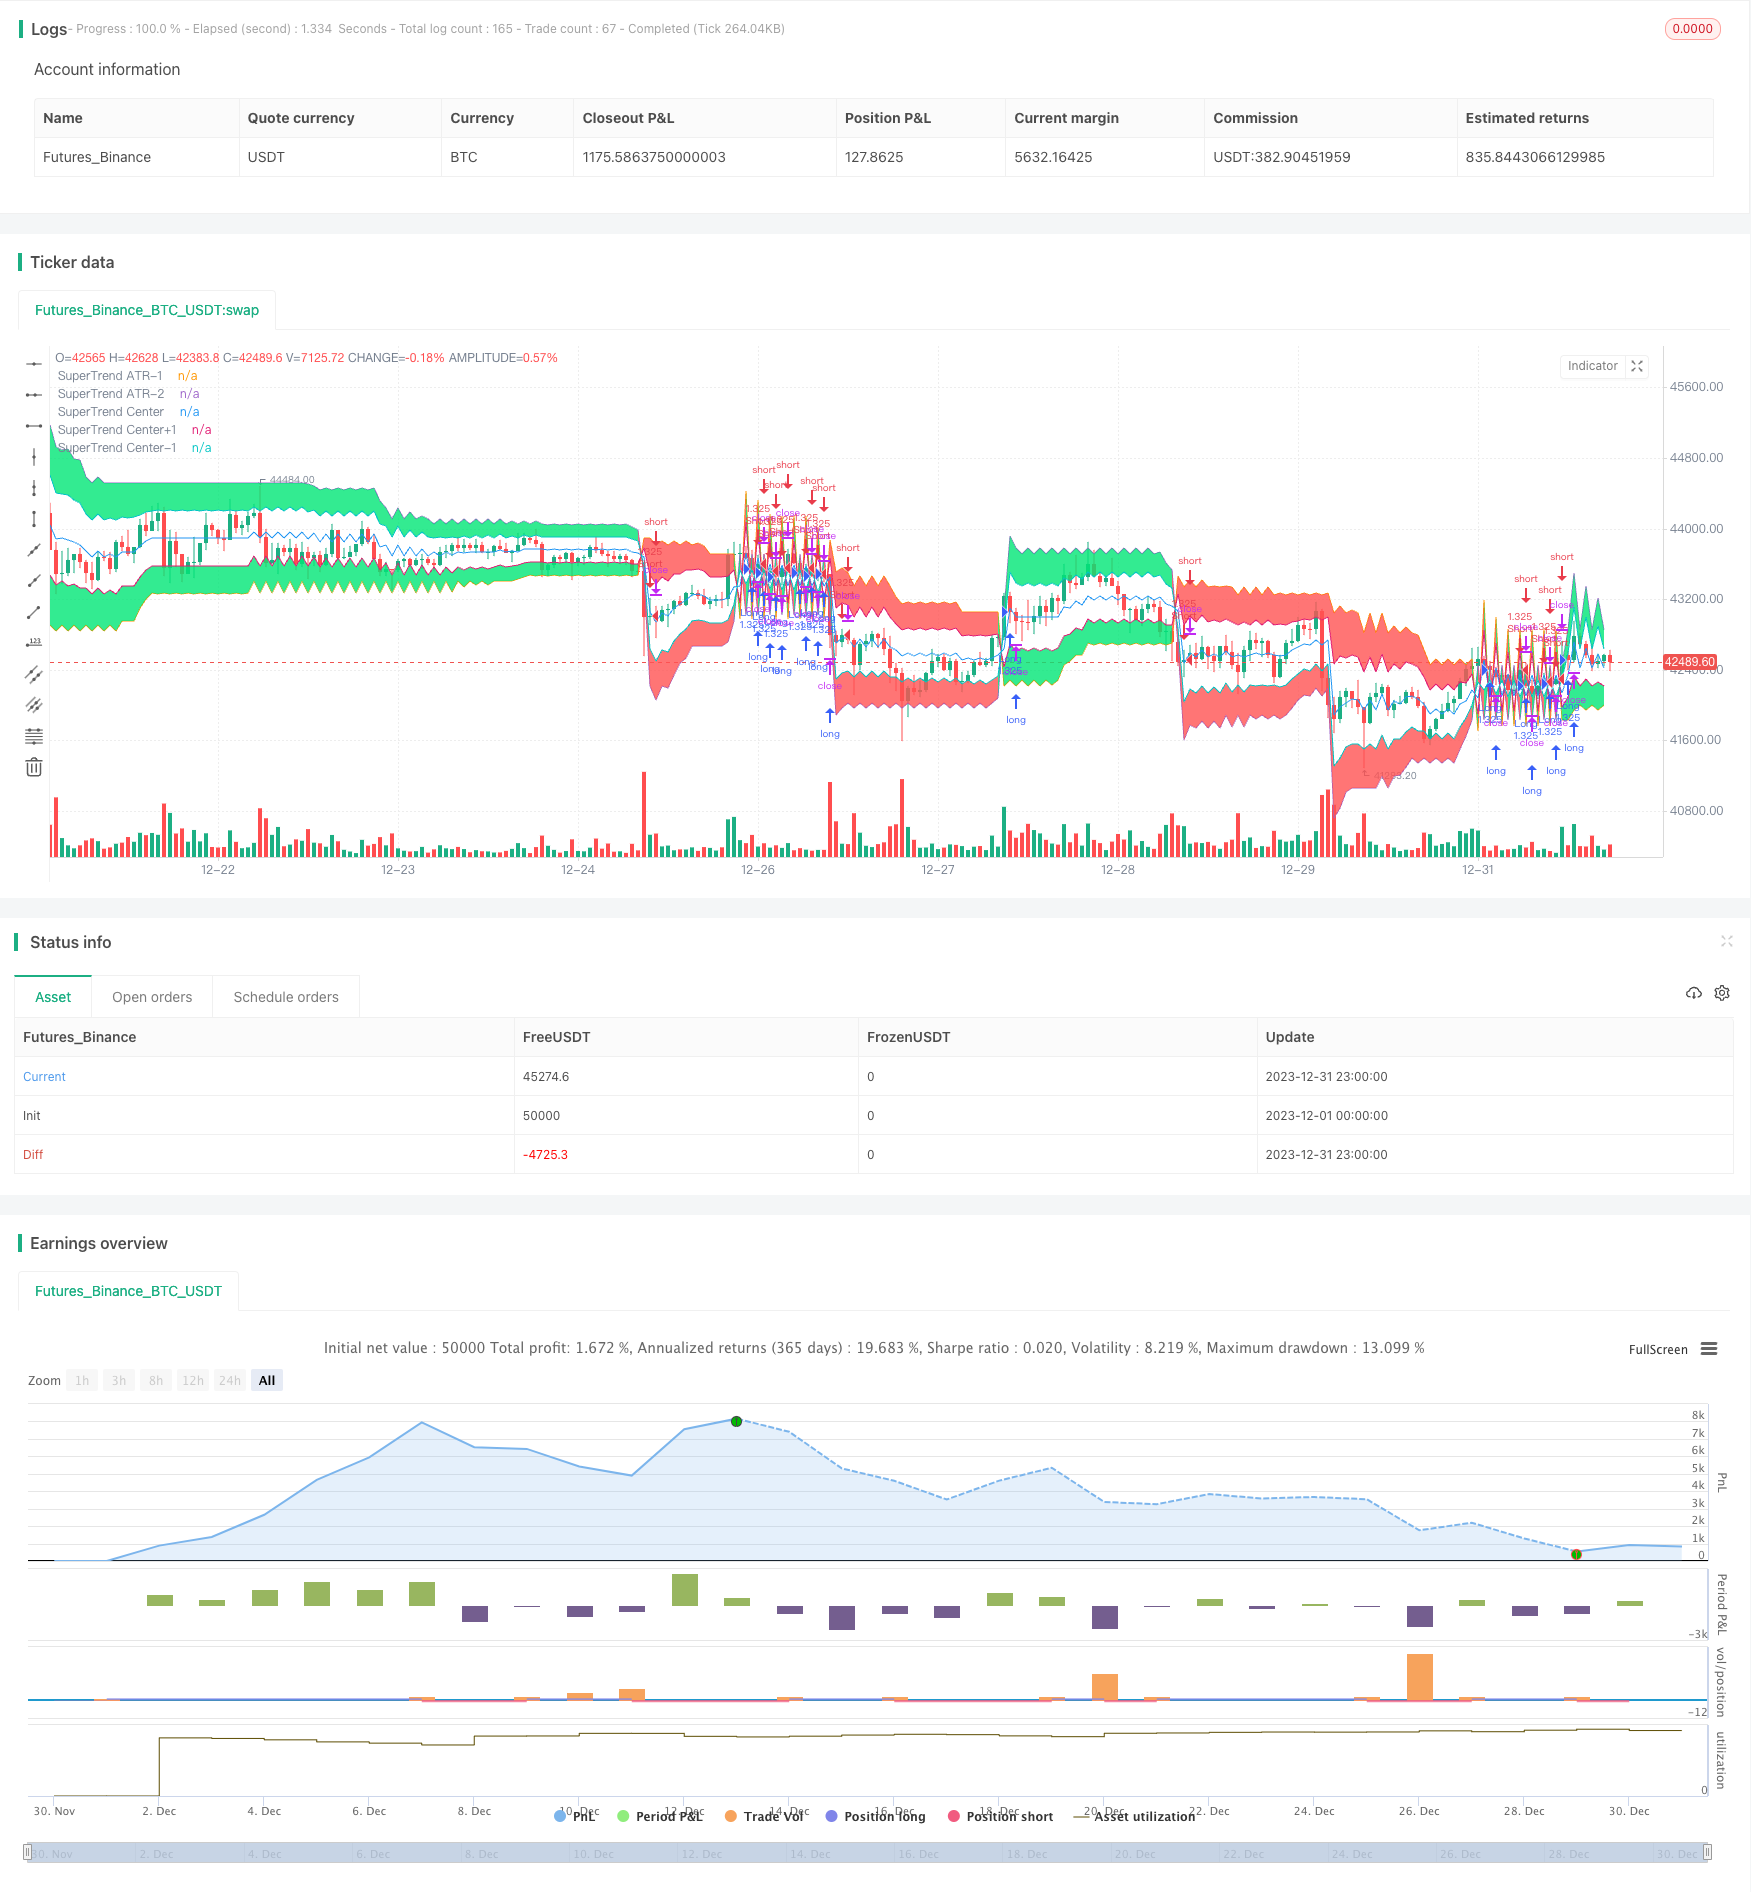
/*backtest
start: 2023-12-01 00:00:00
end: 2023-12-31 23:59:59
period: 1h
basePeriod: 15m
exchanges: [{"eid":"Futures_Binance","currency":"BTC_USDT"}]
*/

//Noro
//2018

//@version=2
strategy("Noro's SuperTrend Strategy v1.0", shorttitle = "ST str 1.0", overlay = true, default_qty_type = strategy.percent_of_equity, default_qty_value = 100, pyramiding = 0)

//Settings
needlong = input(true, defval = true, title = "Long")
needshort = input(true, defval = true, title = "Short")
capital = input(100, defval = 100, minval = 1, maxval = 10000, title = "Lot, %")
cloud = input(25, defval = 25, minval = 5, maxval = 50, title = "cloud, % of ATR")
Factor = input(title = "Super Trend", defval = 3, minval = 1, maxval = 100)
ATR = input(title = "ATR", defval = 7, minval = 1,maxval = 100)
centr = input(true, defval = true, title = "need center of ATR?")
border = input(false, defval = false, title = "need border?")
fromyear = input(1900, defval = 1900, minval = 1900, maxval = 2100, title = "From Year")
toyear = input(2100, defval = 2100, minval = 1900, maxval = 2100, title = "To Year")
frommonth = input(01, defval = 01, minval = 01, maxval = 12, title = "From Month")
tomonth = input(12, defval = 12, minval = 01, maxval = 12, title = "To Month")
fromday = input(01, defval = 01, minval = 01, maxval = 31, title = "From day")
today = input(31, defval = 31, minval = 01, maxval = 31, title = "To day")

//Super Trend ATR 1
src = close
Up=hl2-(Factor*atr(ATR))
Dn=hl2+(Factor*atr(ATR))
TUp=close[1]>TUp[1]? max(Up,TUp[1]) : Up
TDown=close[1]<TDown[1]? min(Dn,TDown[1]) : Dn
Trend = close > TDown[1] ? 1: close< TUp[1]? -1: nz(Trend[1],1)
Tsl1 = Trend==1? TUp: TDown
Tsl2 = Trend==1? TDown: TUp
limit = (Tsl1 - Tsl2) / 100 * cloud
upcloud = Tsl1 - limit
dncloud = Tsl2 + limit

//Cloud
linecolor = Trend == 1 ? green : red
centercolor = centr == true ? blue : na
cloudcolor = Trend == 1 ? green : red
cline = (Tsl1 + Tsl2) / 2
P1 = plot(Tsl1, color = border == false ? na : linecolor , style = line , linewidth = 1,title = "SuperTrend ATR-1")
P2 = plot(Tsl2, color = border == false ? na : linecolor , style = line , linewidth = 1,title = "SuperTrend ATR-2")
P3 = plot(cline, color = centercolor , style = line , linewidth = 1,title = "SuperTrend Center")
P4 = plot(upcloud, color = border == false ? na : linecolor , style = line , linewidth = 1,title = "SuperTrend Center+1")
P5 = plot(dncloud, color = border == false ? na : linecolor , style = line , linewidth = 1,title = "SuperTrend Center-1")
fill(P1, P4, color = linecolor == red ? red : lime, transp = 50)
fill(P2, P5, color = linecolor == red ? red : lime, transp = 50)

//Signals
up = Trend == 1 and close < open //and low < cline
dn = Trend == -1 and close > open //and high > cline

//Trading
size = strategy.position_size
lot = 0.0
lot := size == 0 ? strategy.equity / close * capital / 100 : lot[1]
if up
    strategy.entry("Long", strategy.long, needlong ? lot : 0)

if dn
    strategy.entry("Short", strategy.short, needshort ? lot : 0)