概述
该策略是一种基于趋势追踪移动平均线的交易策略。它利用不同参数设置的最高价和最低价的移动平均线来判断市场趋势,并在趋势转折点 generating 对应的交易信号。当价格突破向上追踪的移动平均线时,做多;当价格跌破向下追踪的移动平均线时,做空。该策略同时利用ATR来设置止损和止盈水平。
策略原理
该策略使用不同参数设置的最高价和最低价的简单移动平均线来判断市场趋势。具体来说,它创建了两个组追踪移动平均线:
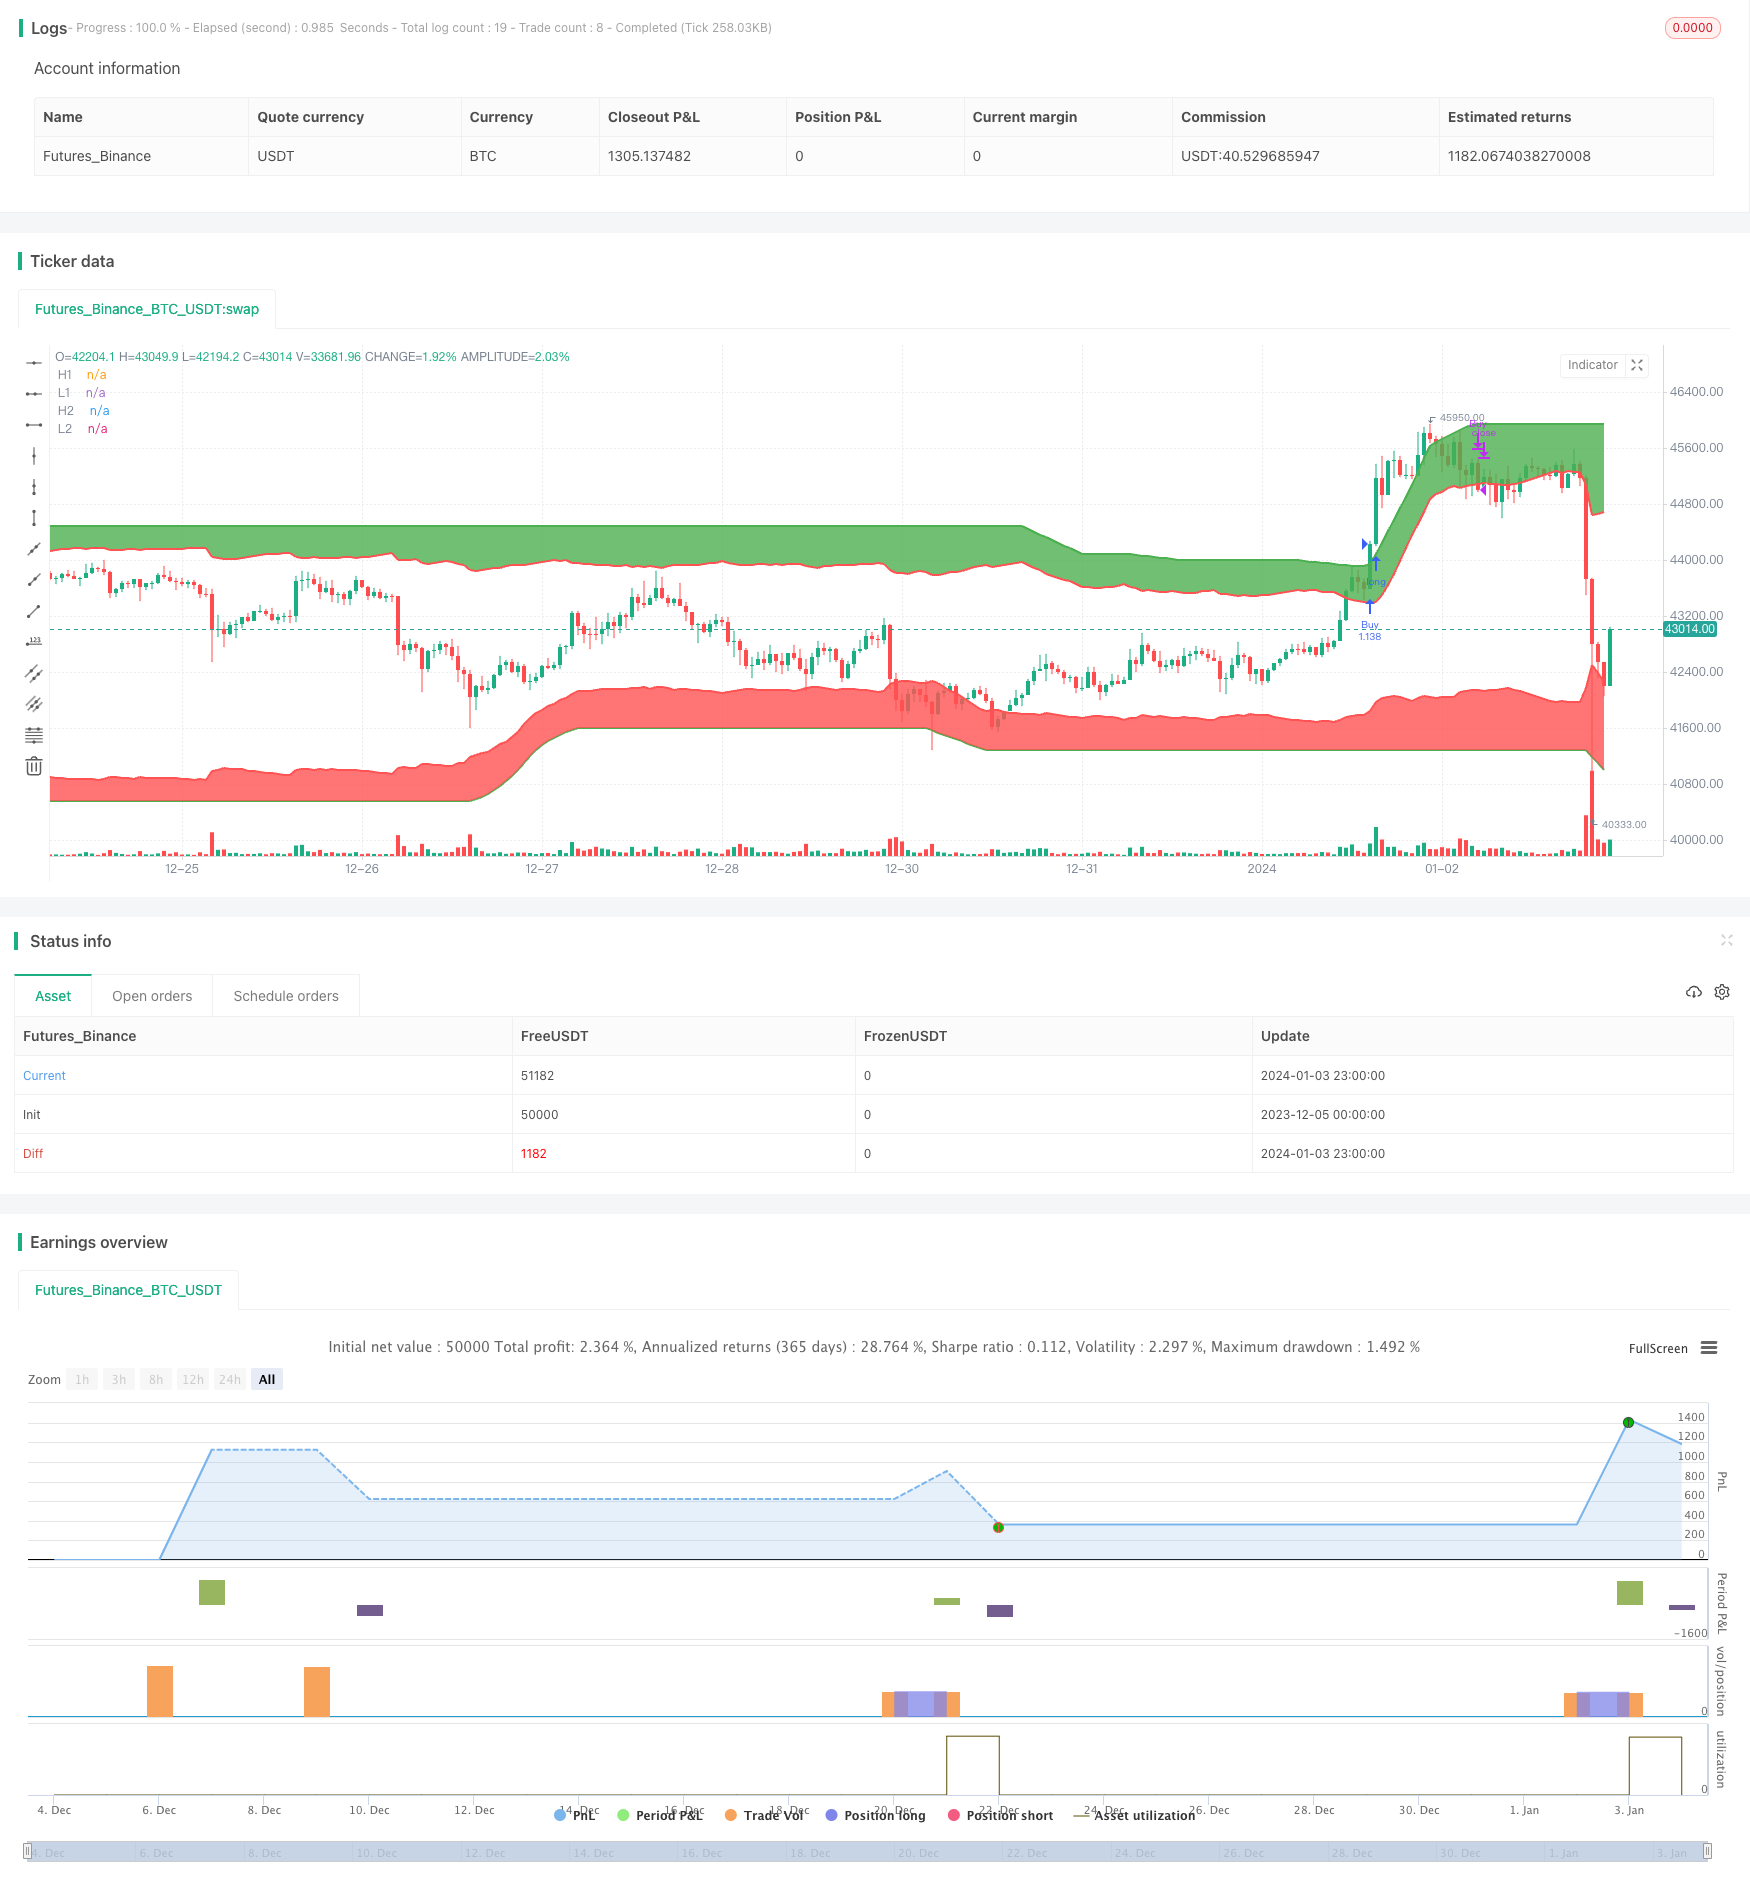
h1 和 l1 组成的向上追踪移动平均系统。h1 是最高价的简单移动平均线,表示市场趋势的上轨;l1 是 h1减去ATR值构成的下轨。当价格上穿h1时产生做多信号;当价格下穿l1时产生平仓信号。
h2 和 l2 组成的向下追踪移动平均系统。h2 是最低价的简单移动平均线,表示市场趋势的下轨;l2 是 h2加上ATR值构成的上轨。当价格下穿h2时产生做空信号;当价格上穿l2时产生平仓信号。
利用双轨系统可以更准确地判断趋势转折点,过滤掉部分噪音交易。同时,ATR值被用来设置止损和止盈水平,控制每单的风险收益比。
优势分析
该策略主要有以下几个优势:
- 利用双轨系统过滤噪音,识别趋势转折点更加准确。
- ATR动态跟踪波动率,可以有效控制单笔止损。
- 策略逻辑简单清晰,容易理解实现,适合新手学习。
- 可灵活调整参数,适应不同市场环境。
风险分析
该策略也存在一些风险:
- 双轨突破产生信号可能滞后,无法充分捕捉趋势开始阶段的机会。
- 追踪移动平均线对曲线形趋势的识别能力较弱。
- 未考虑交易费用的影响。高频交易时交易费用可能比较大。
对策: 1. 适当缩短移动平均线周期,使信号更加灵敏。 2. 结合其他指标如MACD等判断走势类型,避免在震荡区间高频交易。 3. 调整仓位规模,降低交易频率。
优化方向
该策略可以从以下几个方面进行优化:
- 利用机器学习算法自动优化参数,适应市场环境。
- 结合交易量指标避免假突破。
- 增加微调仓位的规则,让仓位大小与趋势强度挂钩。
- 优化止损机制,运用trailer stop等方式。
总结
该策略整体来说是一个简单实用的趋势追踪策略,核心理念是通过双轨过滤和ATR动态止损来识别趋势转折并限制单笔损失。具有一定的实战价值,同时也有较大的优化空间。通过参数调优、结合其他指标等方式可以获得更好的效果。
策略源码
/*backtest
start: 2023-12-05 00:00:00
end: 2024-01-04 00:00:00
period: 1h
basePeriod: 15m
exchanges: [{"eid":"Futures_Binance","currency":"BTC_USDT"}]
*/

//@version=4
strategy("I Like Winners And Love Loosers!", overlay=true, default_qty_type=strategy.percent_of_equity, default_qty_value=100)

highest_length = input(200, type=input.integer, minval=1, title="Highest Length")
highest_average = input(10, type=input.integer, minval=1, title="Highest Average Length")

lowest_length = input(200, type=input.integer, minval=1, title="Lowest Length")
lowest_average = input(10, type=input.integer, minval=1, title="Lowest Average Length")

atr_length = input(14, type=input.integer, minval=1, title="ATR Length")
atr_multiplier = input(2, type=input.integer, minval=1, title="ATR Multiplier")
a = atr(atr_length) * atr_multiplier

h1 = sma(highest(high, highest_length), highest_average)
l1 = h1 - a

h2 = sma(lowest(low, lowest_length), lowest_average)
l2 = h2 + a

buy1_signal = crossover(close, h1)
sell1_signal = crossunder(close, l1)
strategy.entry("Buy", strategy.long, when=buy1_signal)
strategy.close("Buy", when=sell1_signal)

buy2_signal = crossunder(close, h2)
sell2_signal = crossover(close, l2)
strategy.entry("Sell", strategy.short, when=buy2_signal)
strategy.close("Sell", when=sell2_signal)

y1 = plot(h1, title="H1", color=color.green, transp=50, linewidth=2)
y2 = plot(l1, title="L1", color=color.red, transp=50, linewidth=2)
y3 = plot(h2, title="H2", color=color.green, transp=50, linewidth=2)
y4 = plot(l2, title="L2", color=color.red, transp=50, linewidth=2)

fill(y1,y2,color=color.green)
fill(y3,y4,color=color.red)