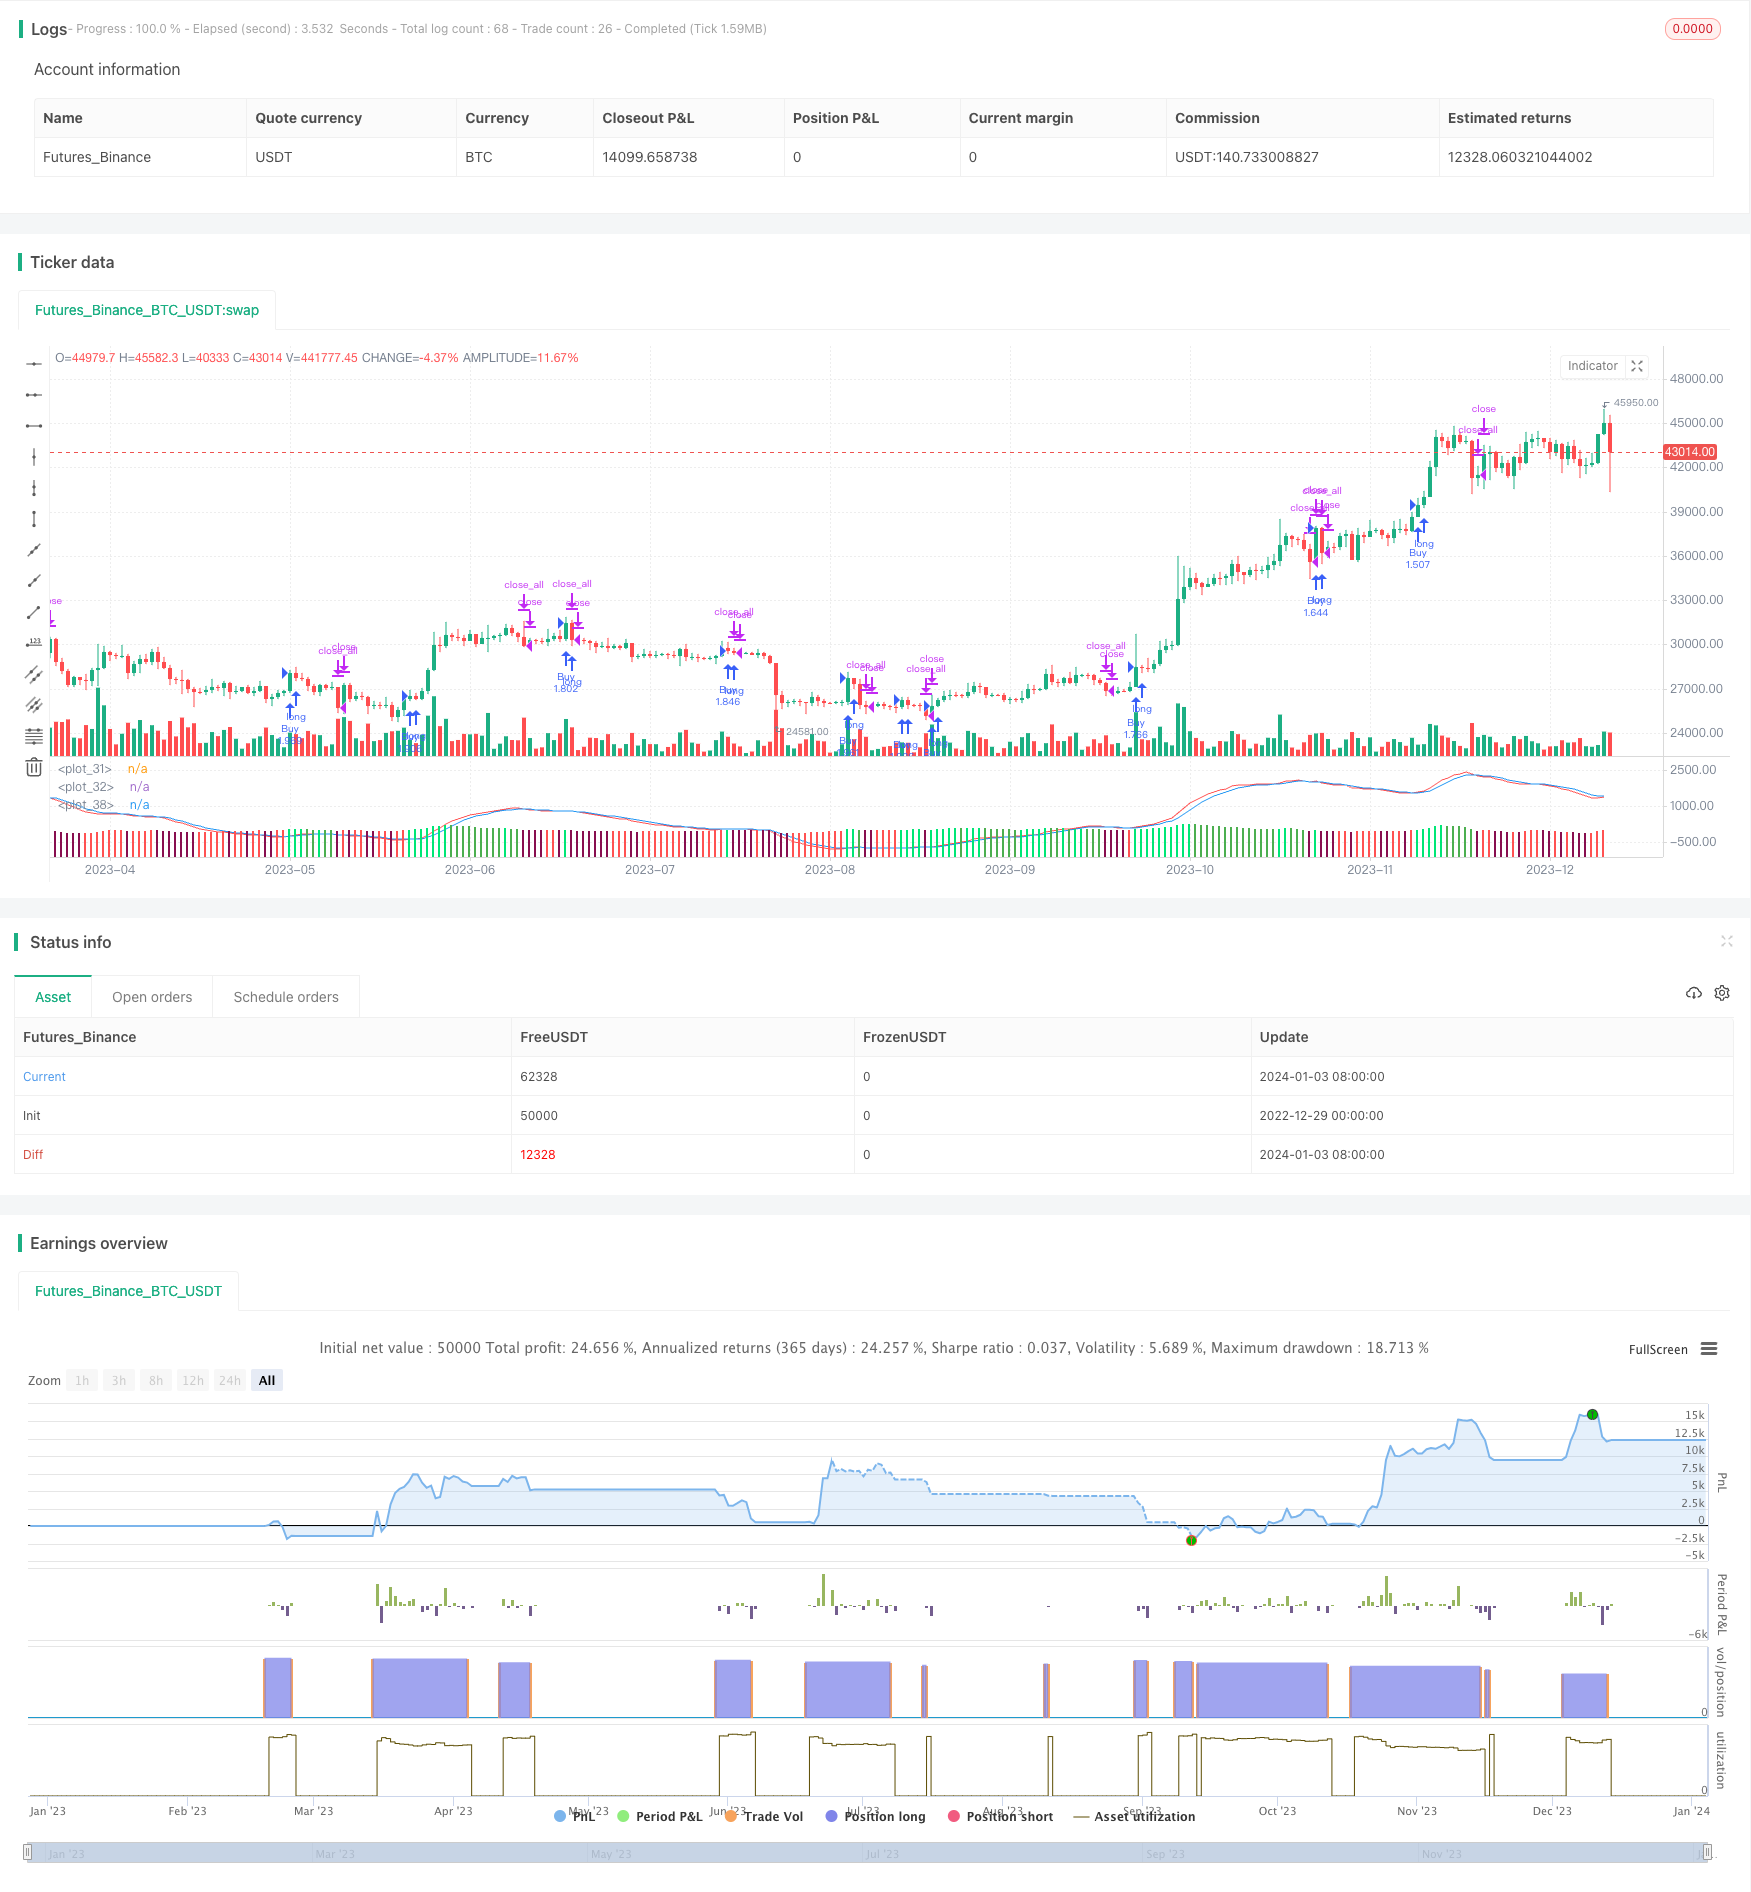
概述
双均线交叉交易策略是一种趋势跟踪策略。它利用快速移动平均线(MACD)和慢速移动平均线的交叉作为买入和卖出信号。当快速移动平均线从下方上扫慢速移动平均线时,产生买入信号;当快速移动平均线从上方下扫慢速移动平均线时,产生卖出信号。
策略原理
该策略基于MACD指标。MACD指标是两条不同参数的移动平均线的差值,反映价格的动量变化。具体来说,是快速移动平均线(默认参数为12日线)减去慢速移动平均线(默认参数为26日线)得到的差值,称为MACD柱。为了消除震荡,MACD指标中又引入了DEA线或称信号线,一般为MACD的9日加权移动平均线。
当MACD柱从下向上突破DEA线而进入正值区域时,说明短期平均线上扫长期平均线,表明股价趋势转为上升,产生买入信号。当MACD从上向下跌破DEA线而进入负值区域时,表明短期平均线下扫长期平均线,股价趋势转为下降,产生卖出信号。
该策略就是利用MACD柱和DEA线的交叉来判断买入和卖出时机。当MACD柱上扫DEA线时买入,下扫时卖出。
优势分析
该策略具有以下优势:
- captured 能够顺势而为,及时抓住价格趋势的变化。
- 简单明了,容易理解和实现。
- 参数较为固定,不需要经常调整。
- 可适用于不同时间周期。
风险分析
该策略也存在一些风险:
- whipsaws 可能产生多次错误信号,即在横盘中反复触发买入卖出。
- lagging 存在一定的滞后性,可能错过价格变化的最佳时机。
- over optimization 参数容易过度优化,实际效果可能不佳。
为了降低风险,可以适当调整参数,或与其它指标结合使用,如量价指标、波动率指标等。此外,合理的止损和止盈策略也很重要。
优化方向
该策略可从以下几个方面进行优化:
参数优化。可以测试不同的参数组合,找到最佳的参数。但要注意避免过度优化。
与其它指标组合。可以引入量价指标、波动率指标等,形成更强大的组合策略。
止损止盈策略。设定合理的止损止盈点,可以有效控制风险。
适配性优化。该策略可以适用于不同市场和时间周期,可以根据实际情况调整。
总结
双均线交叉策略通过捕捉价格趋势的变化,实现低成本的趋势跟踪交易。它简单实用,易于实现,是一种适合新手的入门策略。但该策略也存在一定缺陷,需要注意防范风险。通过不断优化和改进,可以使该策略的实际效果更好,值得推荐。
/*backtest
start: 2022-12-29 00:00:00
end: 2024-01-04 00:00:00
period: 1d
basePeriod: 1h
exchanges: [{"eid":"Futures_Binance","currency":"BTC_USDT"}]
*/

//@version=3
strategy("MACD Strategy by Forbes",default_qty_type=strategy.percent_of_equity, default_qty_value=100, overlay=false)

fastLength = input(20)
slowlength = input(40)
MACDLength = input(4)

// === INPUT BACKTEST RANGE ===
FromYear  = input(defval = 2011, title = "From Year", minval = 2009)
FromMonth = input(defval = 1, title = "From Month", minval = 1, maxval = 12)
FromDay   = input(defval = 1, title = "From Day", minval = 1, maxval = 31)
ToYear    = input(defval = 9999, title = "To Year", minval = 2009)
ToMonth   = input(defval = 12, title = "To Month", minval = 1, maxval = 12)
ToDay     = input(defval = 31, title = "To Day", minval = 1, maxval = 31)

// === FUNCTION EXAMPLE ===
start     = timestamp(FromYear, FromMonth, FromDay, 00, 00)  // backtest start window
finish    = timestamp(ToYear, ToMonth, ToDay, 23, 59)        // backtest finish window
window()  => true // create function "within window of time"

MACD = ema(close, fastLength) - ema(close, slowlength)
aMACD = ema(MACD, MACDLength)
delta = MACD - aMACD

// Plot colors
col_grow_above = #26A69A
col_grow_below = #FFCDD2
col_fall_above = #B2DFDB
col_fall_below = #EF5350

f1 = plot(MACD,color=red)
s1 = plot(aMACD,color=blue)
plotColor = if delta > 0
    delta > delta[1] ? lime : green
else
    delta < delta[1] ? maroon : red

plot(delta, color=plotColor, style=columns)

if (crossover(delta, 0))
    strategy.entry("Buy", true, when=window(), comment="Buy")

if (crossunder(delta, 0))
    strategy.close_all(when=window())

//plot(strategy.equity, title="equity", color=red, linewidth=2, style=areabr)