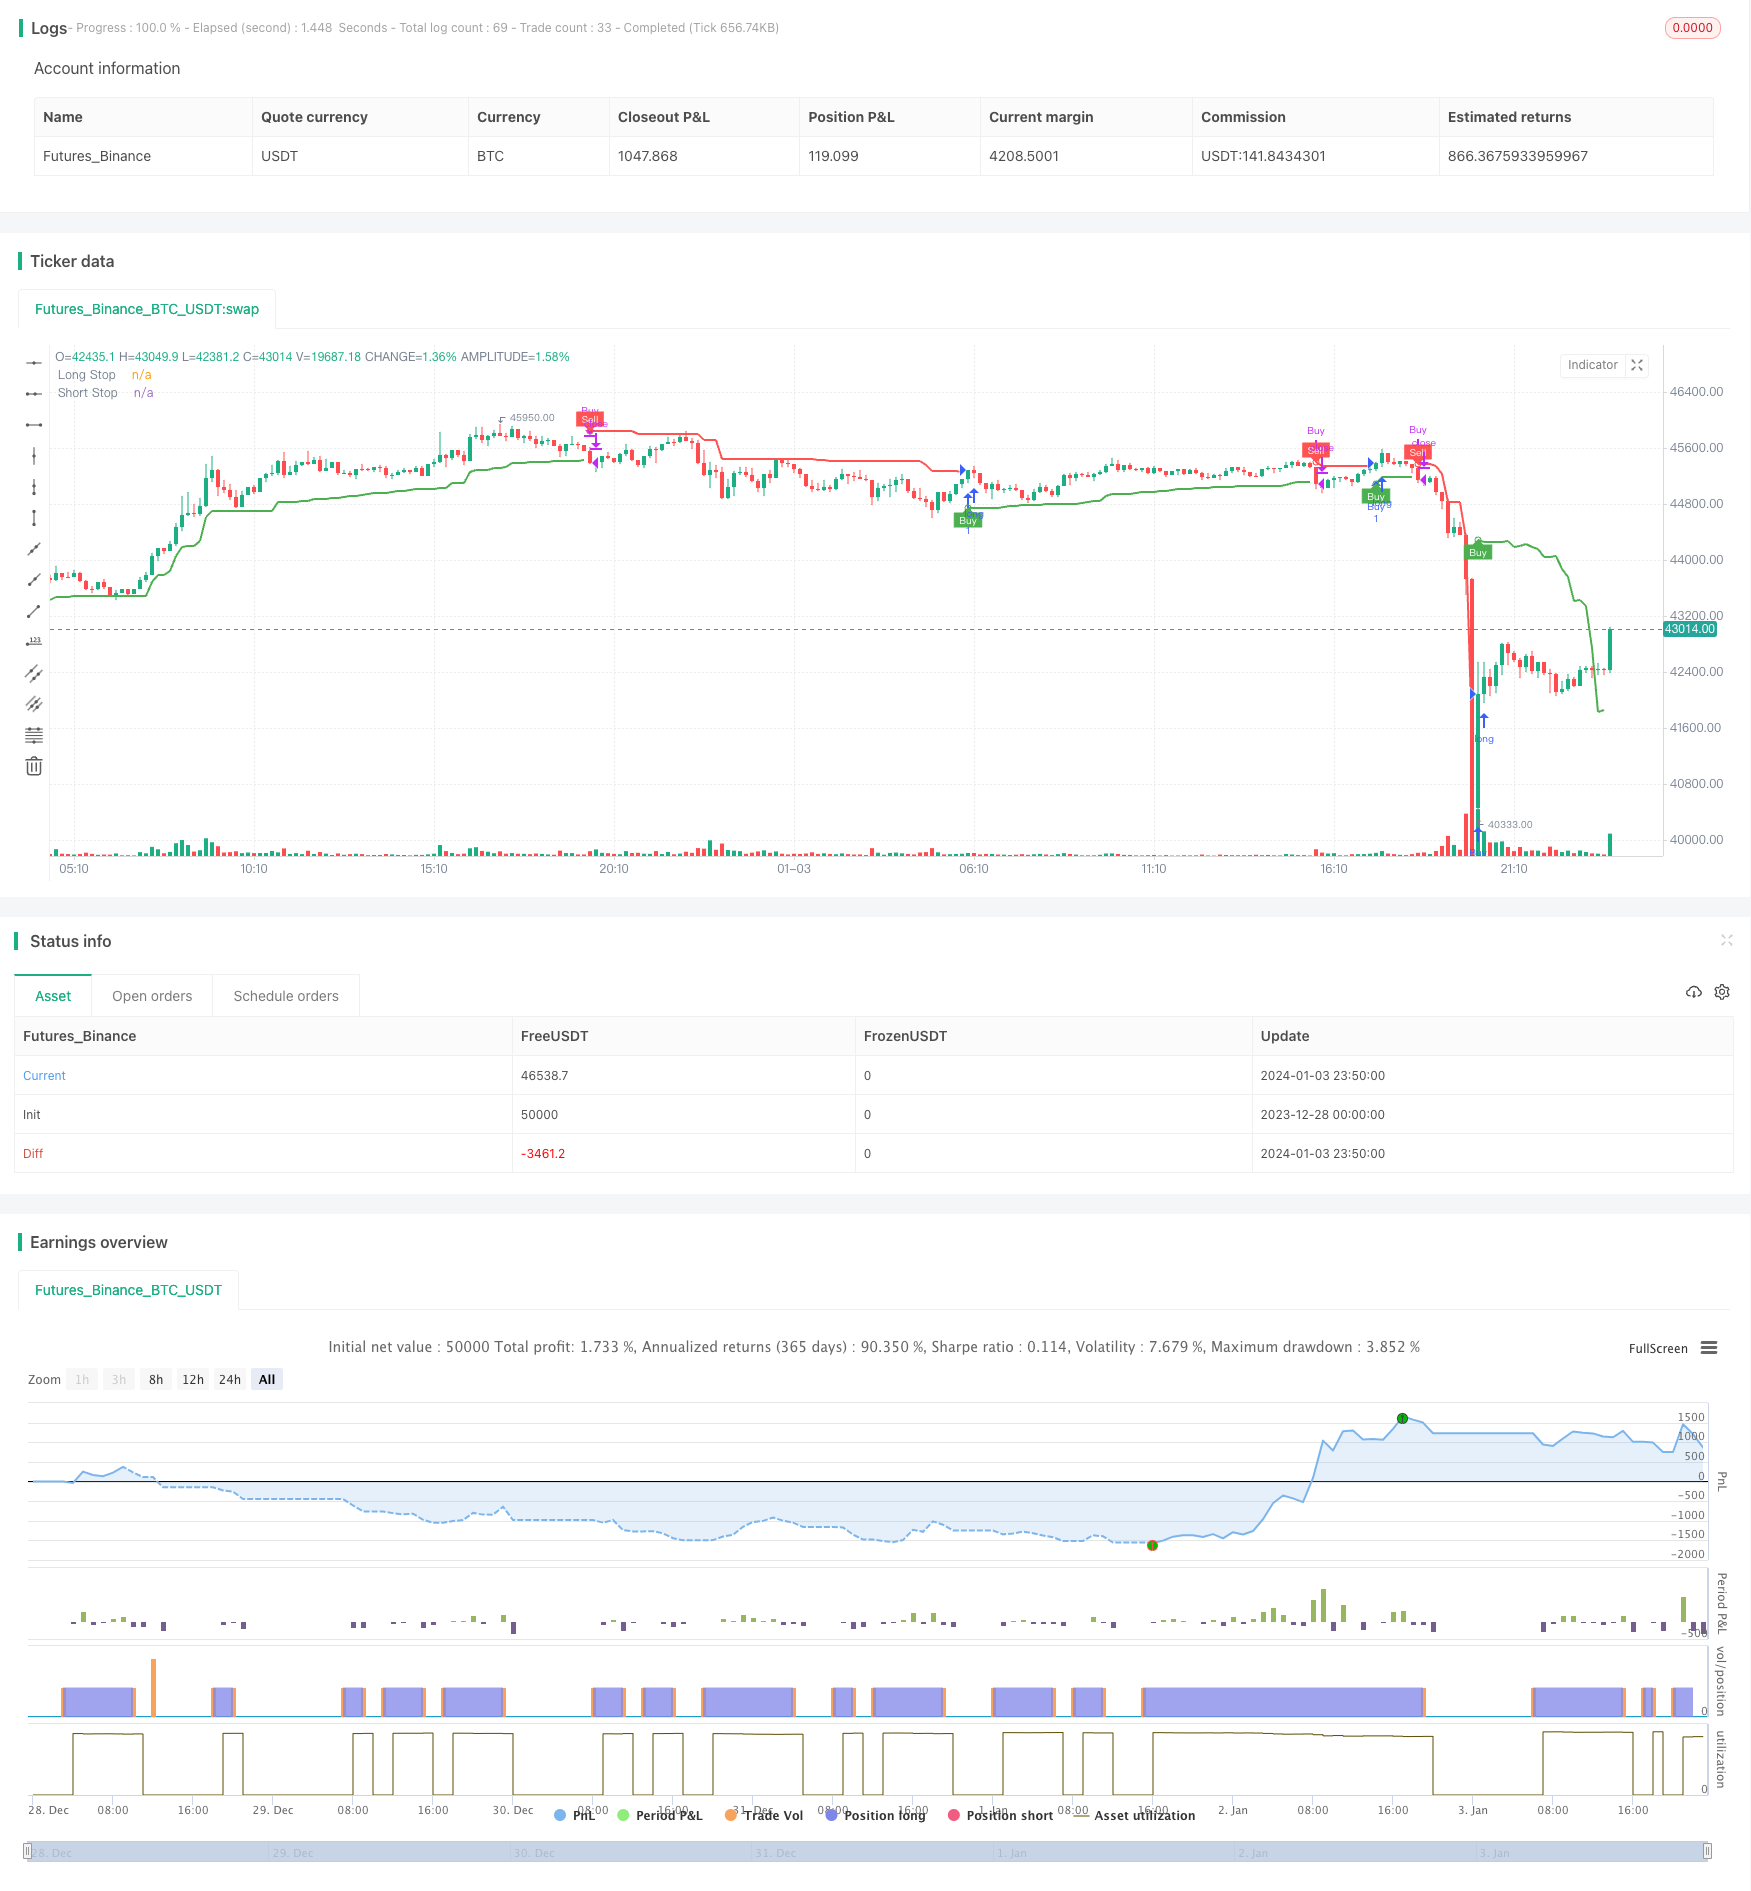
概述
这个策略利用吊灯指标来确定价格突破的方向和力度,从而产生买入和卖出信号。它只进行买入操作。
策略原理
这个策略基于吊灯指标,吊灯指标是根据价格的最高价、最低价和平均真实波动幅度来设置停损线。具体来说,该策略计算22日的平均真实波动幅度,并乘以一个系数(默认为3)。然后根据这一数值设置长线停损线和短线停损线。策略持有多头头寸时,如果价格跌破长线停损线则产生卖出信号;如果空头头寸的时候价格突破短线停损线则产生买入信号。
该策略仅进行买入操作。具体来说,它在价格突破上一次的长线停损线时产生买入信号。然后在价格跌破短线停损线时产生卖出信号并平仓。
优势分析
- 利用吊灯指标设置动态的停损线,可以有效控制风险
- 结合价格突破产生交易信号,可以抓住价格的趋势性 Features
- 只进行买入操作,实现了一个规避行情两端反转的策略
- 设置了多种条件触发的Alert提醒,可以即时监控策略的状态
风险分析
- 吊灯指标对波动幅度较敏感,如果出现异常的价格波动可能会误报信号
- 买入后没有设置止损,无法有效控制亏损风险
- 没有考虑跟踪止盈,无法锁定利润
风险解决方法: 1. 结合其他指标过滤信号,避免误报 2. 设置止损线,限制最大亏损比例 3. 加入跟踪止盈机制,可以考虑动态调整卖出线或部分离场
优化方向
- 可以测试不同的参数设置,优化买入和卖出的时机
- 可以加入其他指标的确认,避免误报信号
- 可以考虑同时进行买入和卖出操作
- 可以设置止损和止盈机制
总结
这个策略利用吊灯指标的动态停损线识别价格反转机会。它仅在价格向上突破长停损线时买入,并在价格跌破短停损线时卖出,实现了一个单边操作、规避行情两端反转的简单策略。该策略有效控制了风险,但没有止损和止盈设置。我们可以通过加入其他指标过滤和设置止损止盈来优化该策略,使其更稳健。
策略源码
/*backtest
start: 2023-12-28 00:00:00
end: 2024-01-04 00:00:00
period: 10m
basePeriod: 1m
exchanges: [{"eid":"Futures_Binance","currency":"BTC_USDT"}]
*/

//@version=5
strategy("Chandelier Exit Strategy", overlay=true)

length = input(title='ATR Period', defval=22)
mult = input.float(title='ATR Multiplier', step=0.1, defval=3.0)
showLabels = input(title='Show Buy/Sell Labels ?', defval=true)
useClose = input(title='Use Close Price for Extremums ?', defval=true)
highlightState = input(title='Highlight State ?', defval=true)

atr = mult * ta.atr(length)

longStop = (useClose ? ta.highest(close, length) : ta.highest(length)) - atr
longStopPrev = nz(longStop[1], longStop)
longStop := close[1] > longStopPrev ? math.max(longStop, longStopPrev) : longStop

shortStop = (useClose ? ta.lowest(close, length) : ta.lowest(length)) + atr
shortStopPrev = nz(shortStop[1], shortStop)
shortStop := close[1] < shortStopPrev ? math.min(shortStop, shortStopPrev) : shortStop

var int dir = 1
dir := close > shortStopPrev ? 1 : close < longStopPrev ? -1 : dir

var color longColor = color.green
var color shortColor = color.red

longStopPlot = plot(dir == 1 ? longStop : na, title='Long Stop', style=plot.style_linebr, linewidth=2, color=color.new(longColor, 0))
buySignal = dir == 1 and dir[1] == -1
plotshape(buySignal ? longStop : na, title='Long Stop Start', location=location.absolute, style=shape.circle, size=size.tiny, color=color.new(longColor, 0))
plotshape(buySignal and showLabels ? longStop : na, title='Buy Label', text='Buy', location=location.absolute, style=shape.labelup, size=size.tiny, color=color.new(longColor, 0), textcolor=color.new(color.white, 0))

shortStopPlot = plot(dir == 1 ? na : shortStop, title='Short Stop', style=plot.style_linebr, linewidth=2, color=color.new(shortColor, 0))
sellSignal = dir == -1 and dir[1] == 1
plotshape(sellSignal ? shortStop : na, title='Short Stop Start', location=location.absolute, style=shape.circle, size=size.tiny, color=color.new(shortColor, 0))
plotshape(sellSignal and showLabels ? shortStop : na, title='Sell Label', text='Sell', location=location.absolute, style=shape.labeldown, size=size.tiny, color=color.new(shortColor, 0), textcolor=color.new(color.white, 0))

changeCond = dir != dir[1]
alertcondition(changeCond, title='Alert: CE Direction Change', message='Chandelier Exit has changed direction!')
alertcondition(buySignal, title='Alert: CE Buy', message='Chandelier Exit Buy!')
alertcondition(sellSignal, title='Alert: CE Sell', message='Chandelier Exit Sell!')

// Define initial capital
initial_capital =25

// Trigger buy order and close buy order on sell signal
if buySignal
    strategy.entry("Buy", strategy.long, qty = initial_capital / close)

if sellSignal
    strategy.close("Buy")