概述
该策略的主要思想是利用短期EMA和长期EMA的交叉作为买入和卖出信号。具体来说,当短期EMA从下方上穿长期EMA时生成买入信号;当短期EMA从上方下穿长期EMA时生成卖出信号。
策略原理
该策略首先定义了短期EMA周期为3天,长期EMA周期为30天。然后计算出这两个EMA的值。短期EMA反映近期价格变动,长期EMA反映长期价格趋势。当短期EMA上穿长期EMA时,表示近期价格开始上涨,跑赢长期趋势,这是建立多头仓位的信号。当短期EMA下穿长期EMA时,表示近期价格开始下跌,跑输长期趋势,这是建立空头仓位的时机。
具体来说,该策略定义了一个差值来判断EMA的交叉。当差值大于阈值0.0005时产生买入信号,小于阈值-0.0005时产生卖出信号。差值的正负代表短期EMA在长期EMA之上或之下。 traders以此来决定开仓方向。
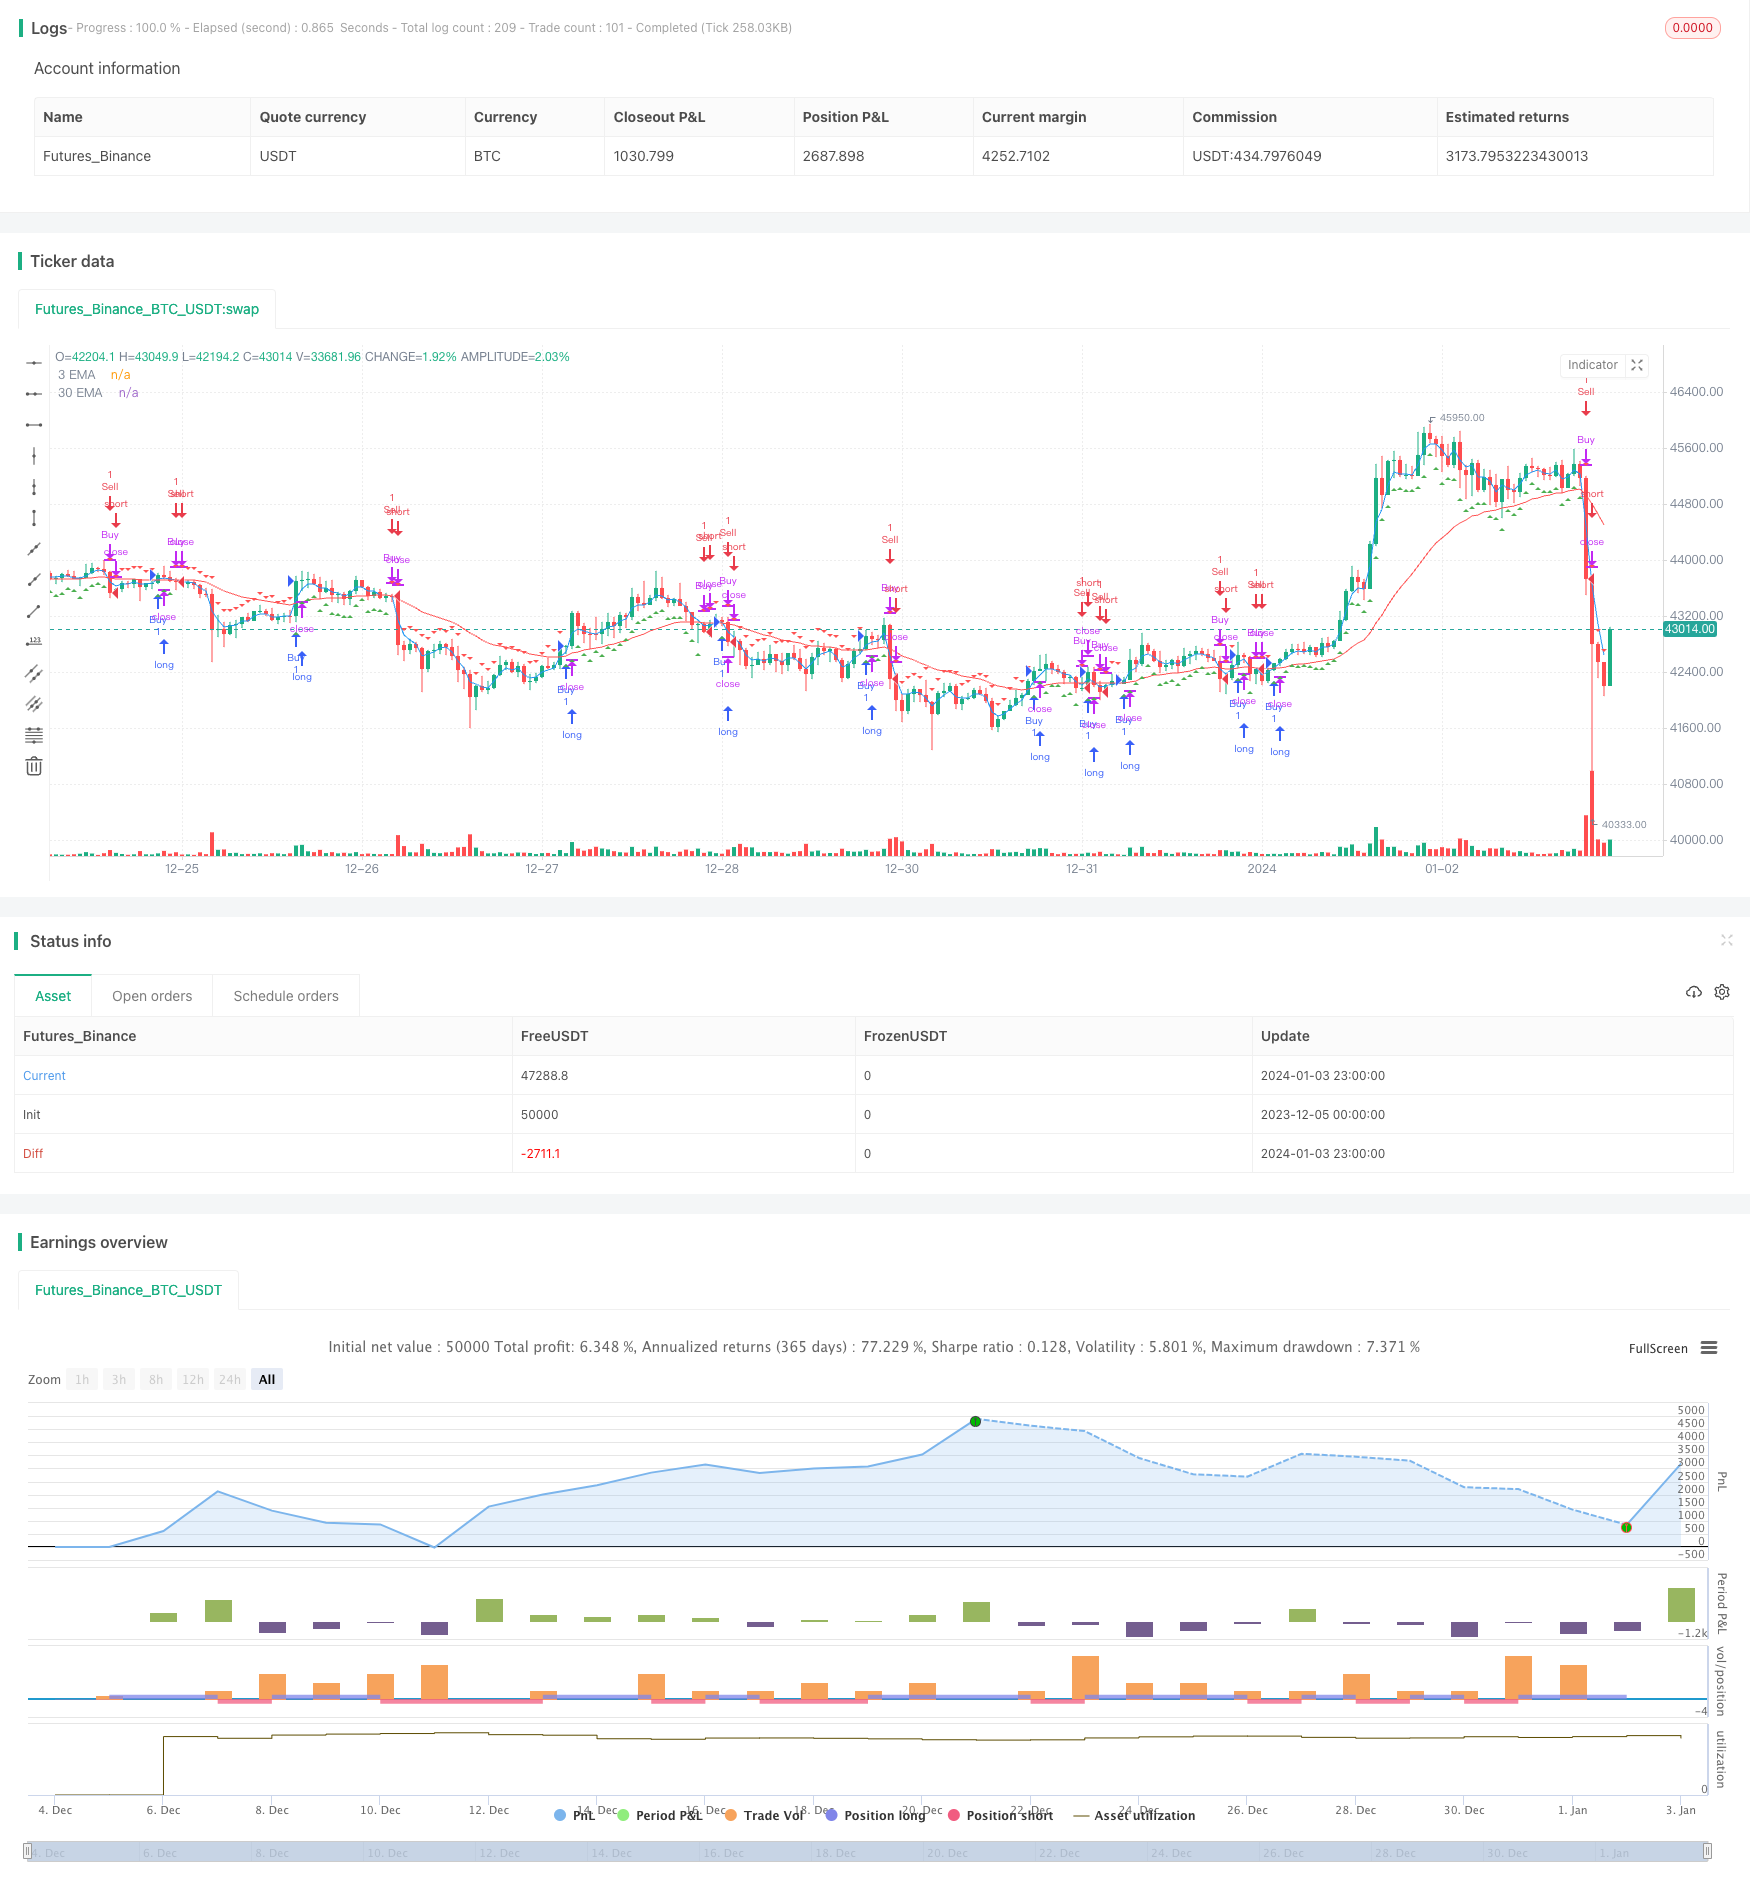
该策略同时在K线图上标记了triangle up和triangle down的图形来直观显示买入卖出信号。
优势分析
该策略最大的优势在于简单有效,利用EMA这一最基础指标判断市场结构,避免了过于复杂的模型带来的曲线拟合风险。
EMA作为一种趋势跟踪指标,能有效平滑随机性噪声,判断长短期趋势方向。相比长短期均线交叉等其他常见指标,EMA计算上具有指数平滑特点,能更快速地响应价格变动。
此外,该策略同时结合多个EMA周期,通过长短期EMA的交叉,能在一定程度上过滤假突破。这与单一EMA周期策略相比也更为稳健。
风险分析
该策略最大的风险在于EMA本身的滞后性。当快速跳空或价格反转来袭时,EMA交叉信号往往会滞后,无法及时反映市场变化。这可能导致错过最佳开仓时机或未及时止损。
此外,EMA周期的选择也会影响策略表现。如果周期选择不当,将导致产生过多错误信号。例如短期周期过短可能导致对市场噪音过于敏感;长期周期过长则无法及时捕捉趋势转折。
最后,固定增量的进入退出阈值也可能导致仓位控制不当。当波动率较大时,应适当调整阈值以控制仓位。
优化方向
该策略可从以下几个方面进行优化:
- 动态优化EMA周期。可以根据市场状态选择或自动优化最佳短长期EMA组合,提高策略稳健性。
2.引入自适应止损机制。在保证止损的同时,根据市场波动率设定合理的移动止损线,避免过于激进停损。
3.结合其他指标过滤信号。例如仓位控制指标、波动率指标等,避免EMA交叉信号在高波动时带来较大亏损。
4.引入机器学习技术。训练模型预测最佳的EMA周期参数组合。另外也可以预测EMA差值,得到更精确的交易信号。
总结
该短期长期EMA决策合并策略总的来说非常简单直接,通过EMA这一基础指标判断多空市场结构,避免了过度优化和模型风险。同时结合多个EMA周期也提高了信号质量。但我们也要注意EMA本身的滞后性可能带来的风险,这需要后续适当优化来解决。
/*backtest
start: 2023-12-05 00:00:00
end: 2024-01-04 00:00:00
period: 1h
basePeriod: 15m
exchanges: [{"eid":"Futures_Binance","currency":"BTC_USDT"}]
*/

//@version=5
strategy("Merged EMA Strategy", shorttitle="MergedEMA", overlay=true)

// Define EMA periods
shortEMA = ta.ema(close, 3)
longEMA = ta.ema(close, 30)

// Plot EMAs on the chart
plot(shortEMA, color=color.blue, title="3 EMA")
plot(longEMA, color=color.red, title="30 EMA")

// Calculate the difference between short and long EMAs
emaDifference = shortEMA - longEMA

// Set threshold for buy and sell signals
buyThreshold = 0.0005
sellThreshold = -0.0005

// Define buy and sell conditions
buyCondition = emaDifference > buyThreshold
sellCondition = emaDifference < sellThreshold

// Plot buy and sell signals on the chart
plotshape(series=buyCondition, title="Buy Signal", color=color.green, style=shape.triangleup, location=location.belowbar)
plotshape(series=sellCondition, title="Sell Signal", color=color.red, style=shape.triangledown, location=location.abovebar)

// Strategy logic
strategy.entry("Buy", strategy.long, when = buyCondition)
strategy.close("Buy", when = sellCondition)

strategy.entry("Sell", strategy.short, when = sellCondition)
strategy.close("Sell", when = buyCondition)