概述
本文要介绍的交易策略名为“基于ZigZag指标的趋势追踪交易策略”(ZigZag Trend Following Strategy)。该策略利用ZigZag指标识别价格趋势,并在趋势反转时打开头寸以追踪趋势。在Strategy Pine代码中,ZigZag指标用于确认价格的新高点和新低点。当价格突破ZigZag指示线时作为交易信号。买入信号是收盘价高于ZigZag指示线时做多;卖出信号是收盘价低于ZigZag指示线时做空。这可以有效追踪中长线的价格趋势。
策略原理
该策略的核心是使用ZigZag指标来定位价格的极值点并展示价格趋势。ZigZag指标由高低价的Exponential Moving Average(指数移动平均线)构成。具体来说,分为以下几步构建:
计算close价格的指数移动平均线EMA,包含三条移动平均线:快线、中线、慢线。
判断价格是否上涨趋势。即当前中线是否高于上一根K线的中线。
如果目前是上涨趋势,那么找出从上一波低点开始计数的检测周期内的最低价,作为ZigZag的值。
如果目前是下跌趋势,那么找出从上一波高点开始计数的检测周期内的最高价,作为ZigZag的值。
如此形成了反映价格波动极值点的ZigZag指标。
在此基础上,我们以ZigZag线为参考,判断价格趋势。即当价格上涨时突破ZigZag指示线,我们做多;当价格下跌时突破ZigZag指示线,我们做空。
优势分析
采用ZigZag指标判断价格趋势和追踪价格极值点作为建仓的优势有:
可以有效过滤市场噪音,捕捉主要趋势。
由于建立在价格新高新低突破上的交易信号,可以高效获利。
ZigZag线比较光滑,可以减少假信号。
容易通过调整ZigZag参数来优化策略。
风险分析
该策略的主要风险有:
长期运行可能会因为行情剧烈波动被套牢。这时需要及时止损。
ZigZag指标对参数敏感。不当设置可能错过交易机会或者产生假信号。需要适当测试和优化参数。
追踪趋势策略更依赖于趋势行情。如果遇到震荡盘整理,则该策略效果不佳。
针对以上风险,我们可以设置止损机制控制单笔损失;同时调整持仓规模,不要追求全仓操作;最后,匹配不同类型的策略组合使用。
优化方向
我们可以从以下几个方面继续优化该策略:
增加止损机制。比如设定移动止损或者价格回撤幅度的止损。
结合其他指标过滤进场。例如增强型能量指标,确保有足够的动能;或者交易量指标,确保有放量特征。
根据不同的市场环境(如牛市和熊市)采用不同的参数配置。
测试不同的EMA均线参数以寻找最佳参数组合。
总结
本策略利用ZigZag指标判断价格趋势,在极值点附近建立追踪头寸。其优点是顺势而为,高效获利。同时也存在被套风险。我们可以设置止损,优化参数以及交易策略组合来控制风险。该策略更适合中长线趋势交易。如果控制和组合得当,可以获得稳定收益。
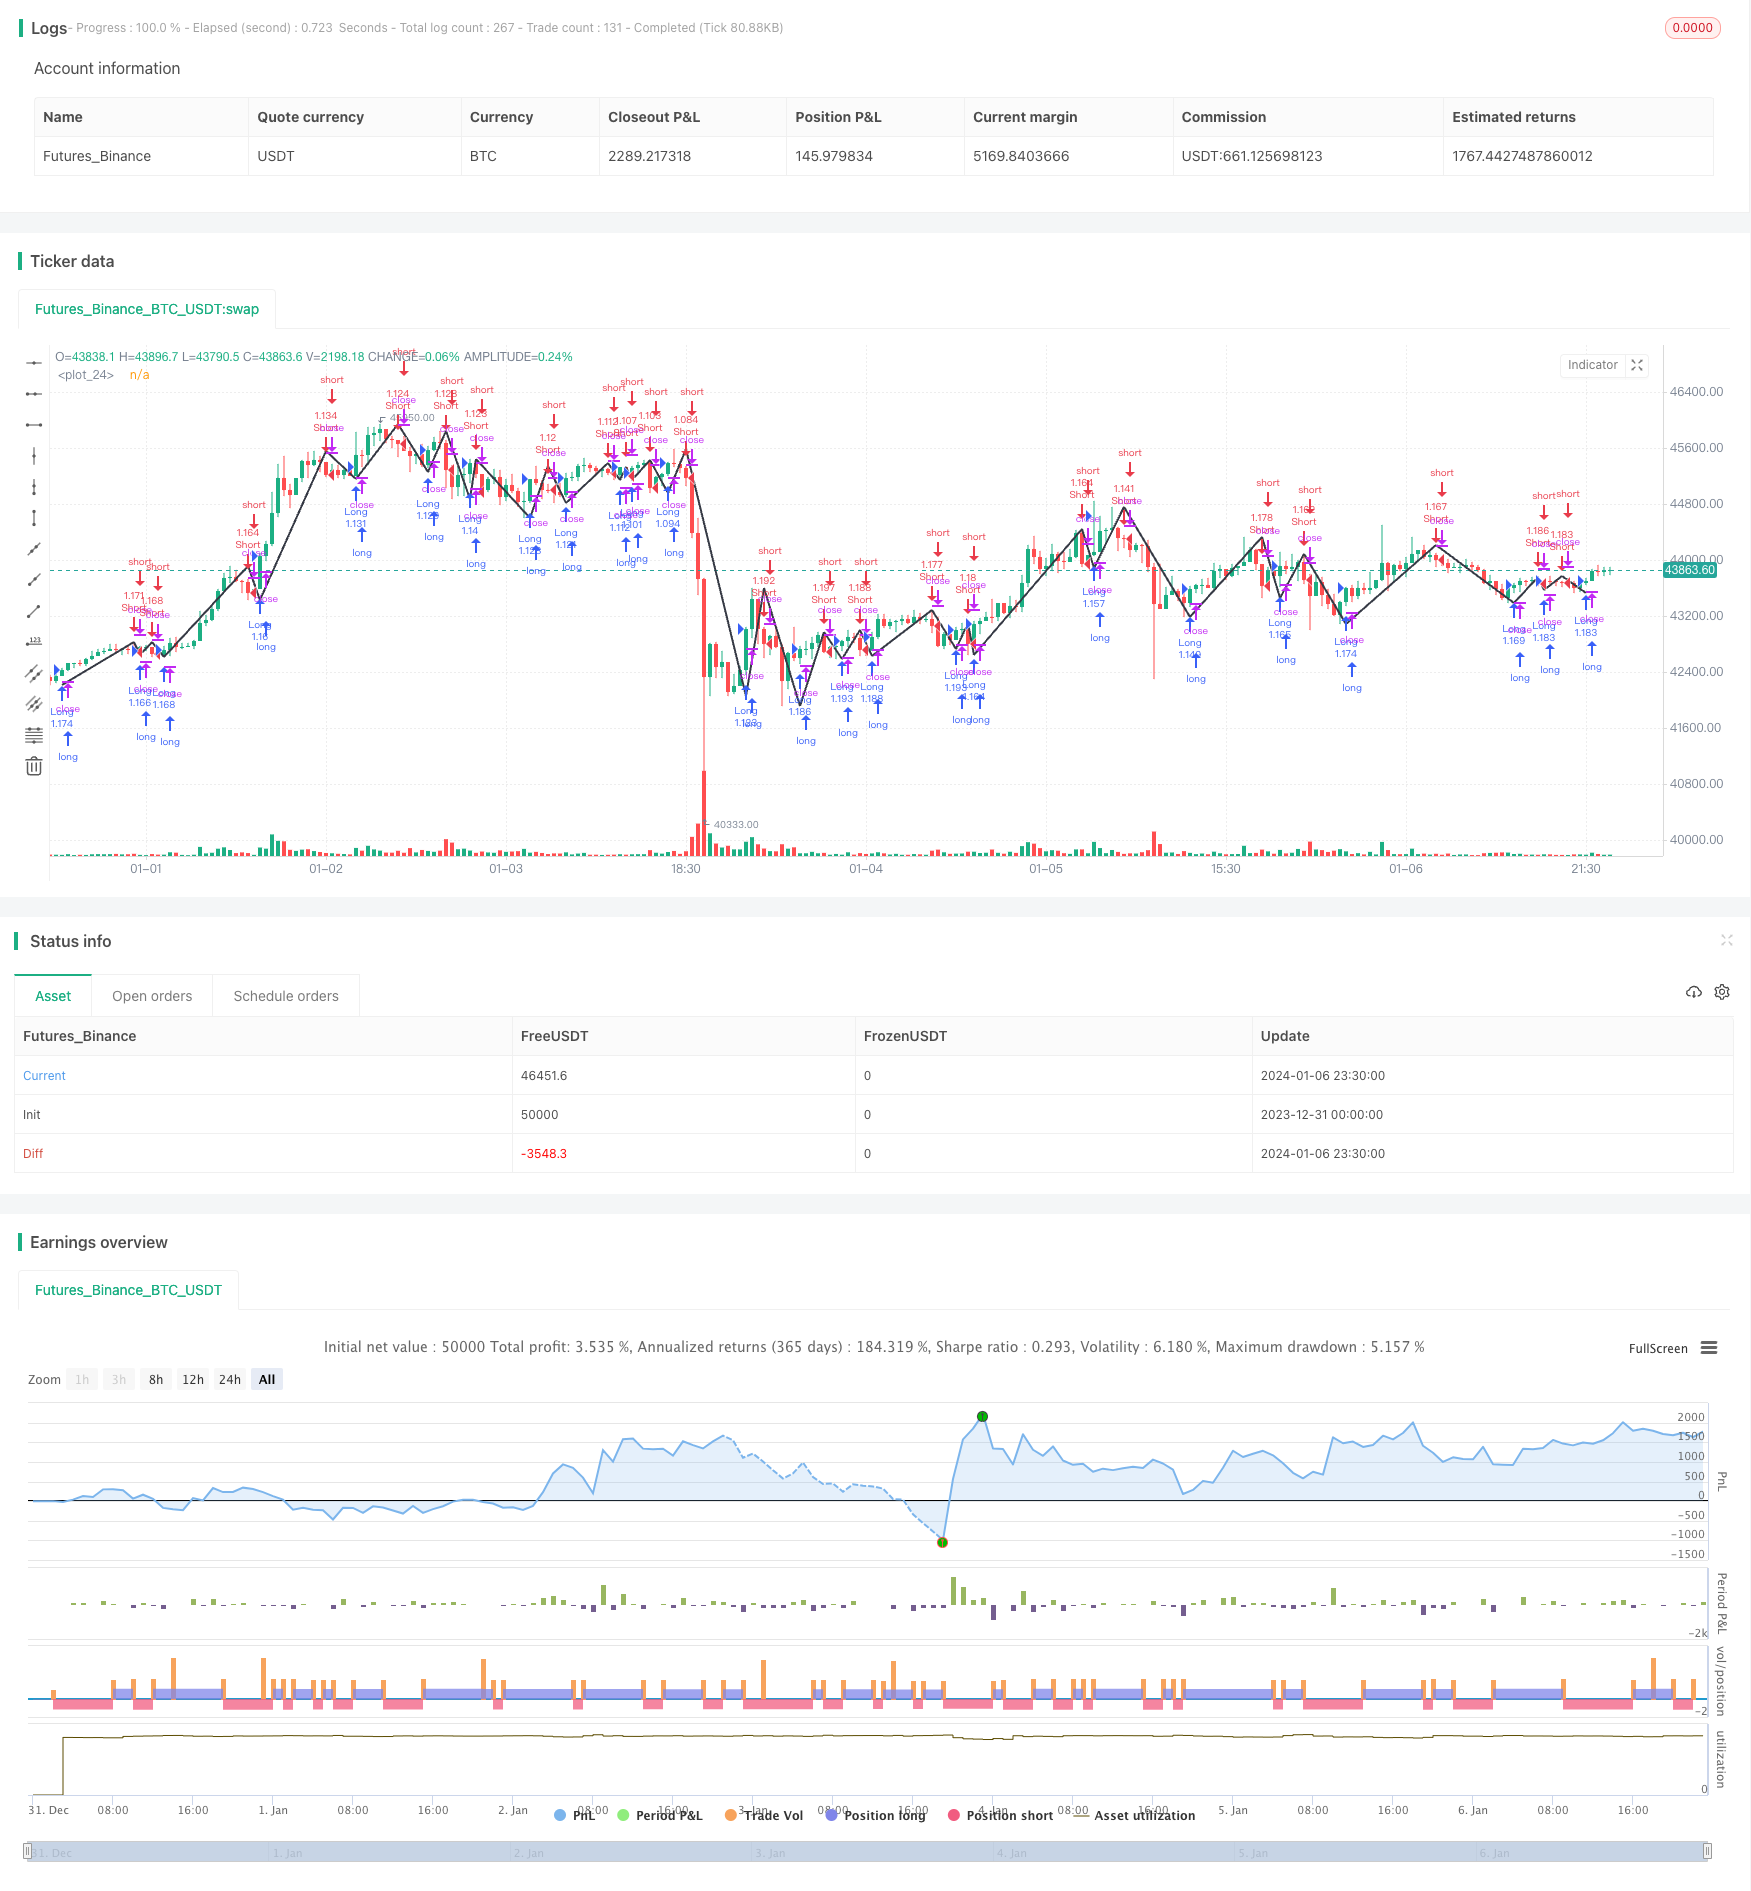
/*backtest
start: 2023-12-31 00:00:00
end: 2024-01-07 00:00:00
period: 30m
basePeriod: 15m
exchanges: [{"eid":"Futures_Binance","currency":"BTC_USDT"}]
*/

//@version=3
strategy(title = "Noro's ZigTrend Strategy v1.0", shorttitle = "ZigTrend 1.0", overlay = true, default_qty_type = strategy.percent_of_equity, default_qty_value = 100, pyramiding = 0)

//Settings
needlong = input(true, defval = true, title = "Long")
needshort = input(true, defval = true, title = "Short")
capital = input(100, defval = 100, minval = 1, maxval = 10000, title = "Capital, %")
length = input(4)
ExtremeDetection = input(4)
src = input(close)
fromyear = input(1900, defval = 1900, minval = 1900, maxval = 2100, title = "From Year")
toyear = input(2100, defval = 2100, minval = 1900, maxval = 2100, title = "To Year")
frommonth = input(01, defval = 01, minval = 01, maxval = 12, title = "From Month")
tomonth = input(12, defval = 12, minval = 01, maxval = 12, title = "To Month")
fromday = input(01, defval = 01, minval = 01, maxval = 31, title = "From day")
today = input(31, defval = 31, minval = 01, maxval = 31, title = "To day")

//ZigZag
f_zz(_length, _detection)=>
    _hls = ema(ema(ema(src, _length), round(_length*0.66)), round(_length*0.33))
    _isRising = _hls >= _hls[1]
    _zigzag = _isRising and not _isRising[1] ? lowest(_detection) :  not _isRising and _isRising[1] ? highest(_detection) : na
zigzag = f_zz(length, ExtremeDetection)
plot(zigzag, color=black, linewidth=2)

//Signals
up = close > zigzag
dn = close < zigzag

//Trading
lot = 0.0
lot := strategy.position_size != strategy.position_size[1] ? strategy.equity / close * capital / 100 : lot[1]
if up
    strategy.entry("Long", strategy.long, needlong == false ? 0 : lot)

if dn
    strategy.entry("Short", strategy.short, needshort == false ? 0 : lot)