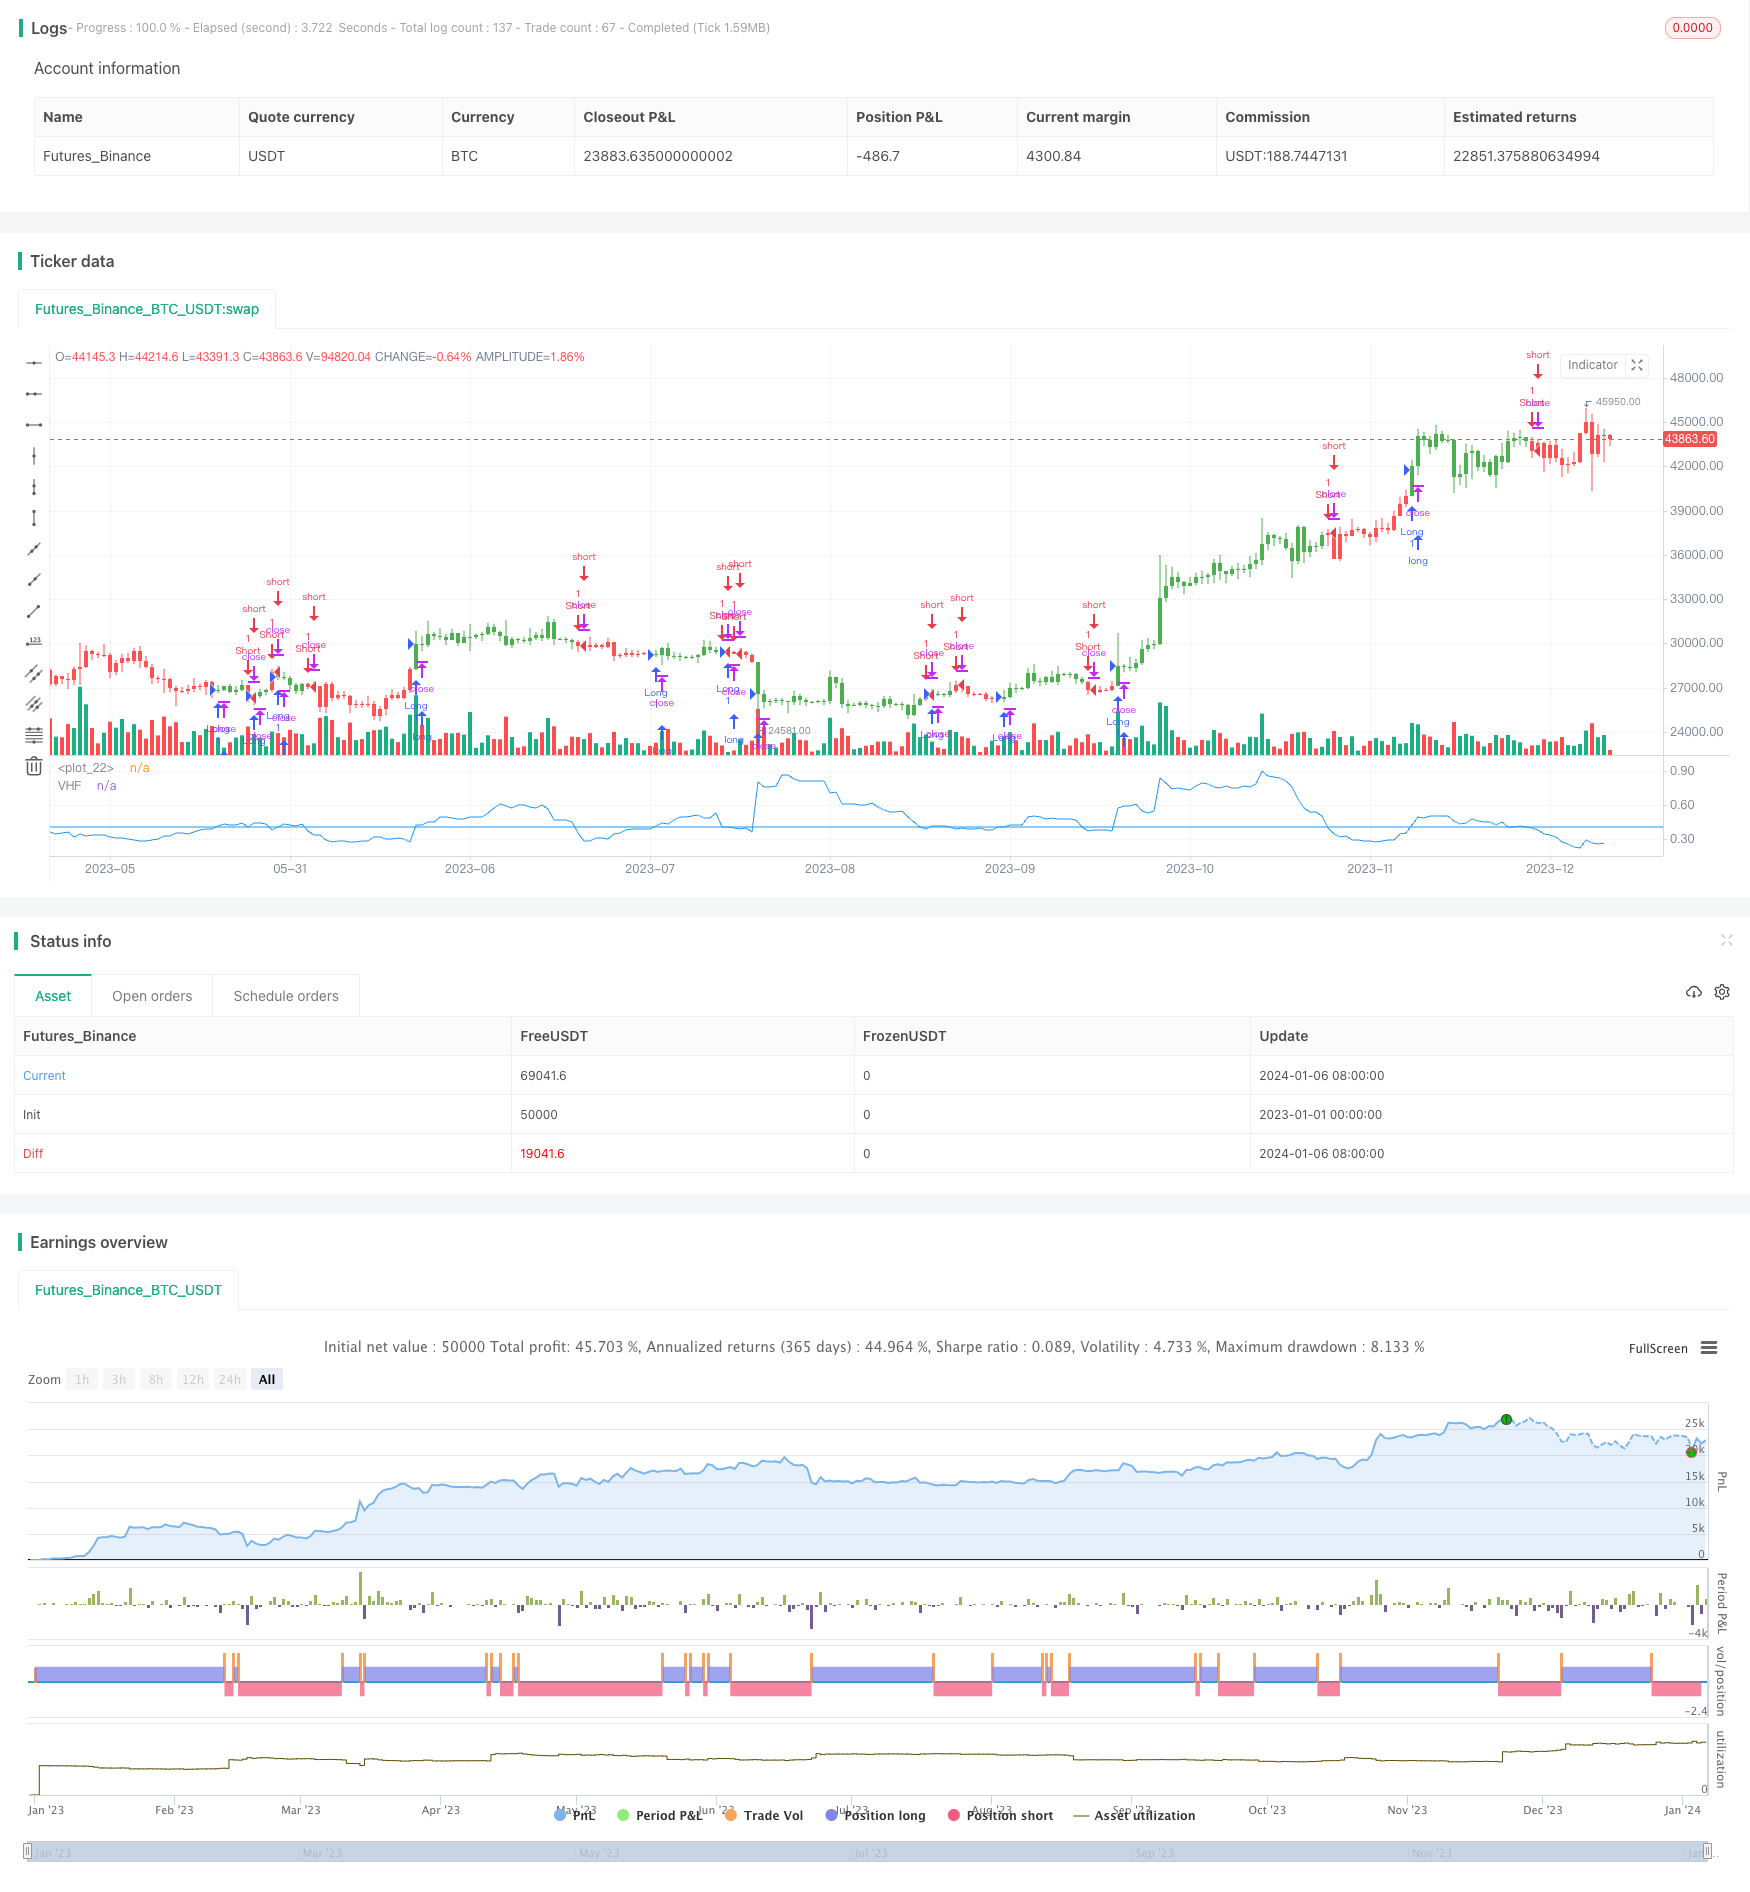
概述:该策略通过计算一定周期内最高价与最低价的差价与收盘价振幅的比值,来判断价格是否处于趋势状态,以此作为交易信号指标。
策略原理:该策略的核心指标是垂直水平滤波器(VHF),它通过以下公式计算:
VHF = (Highest(Length) - Lowest(Length)) / SUM(ABS(Close - Close[1]), Length)
其中Highest(Length)和Lowest(Length)分别是Length周期内的最高价和最低价。分子部分反映了价格的振幅范围,分母部分反映了价格的实际波动量。their比值可以判断价格走势的趋势性,当VHF高于给定信号阈值时,认为价格处于趋势状态;当低于给定信号阈值时,认为价格处于盘整状态。据此产生交易信号。
该策略简单直观,通过比较价格波动范围与实际波幅来判断趋势性,避免了单一依赖SMA,EMA等指标而忽视价格本身特征的问题。但该策略对参数优化敏感,需要调整Length和Signal参数以适应不同周期和市场环境。
优势分析: 1. 直观的趋势判断指标,简单有效。 2. 考虑了价格自身的特征,不依赖任何曲线拟合。 3. 可配置参数调整判断的敏感度。 4. 可轻松融入各类交易策略中。
风险分析: 1. 对参数敏感,不适当设置会导致过多错 trades。 2. 无法区分价格处于转折点时的假趋势。 3. 大周期设置下对短周期价格震荡不敏感。 4. 需搭配止损以控制单笔亏损。
优化方向:
1. 优化Length参数以平衡趋势判断的灵敏度。
2. 结合其他指标过滤VHF信号。例如MACD可判断转折点。
3. 尝试机器学习方法拟合VHF曲线。
4. 不同周期设置并行,产生多级策略信号。
总结:该策略基于价格本身特征直观判断趋势,简单有效,值得进一步探索、优化和验证,可成为基础趋势判断工具,广泛应用于量化交易策略。
/*backtest
start: 2023-01-01 00:00:00
end: 2024-01-07 00:00:00
period: 1d
basePeriod: 1h
exchanges: [{"eid":"Futures_Binance","currency":"BTC_USDT"}]
*/

//@version=2
////////////////////////////////////////////////////////////
//  Copyright by HPotter v1.0 27/04/2018
// Vertical Horizontal Filter was initiated by Adam White. It was first published
// in a magazine called “Issues of Futures” in August, 1991. The Vertical Horizontal
// Filter (VHF) is a very common Indicator used by traders to find out the Phase of
// a Price Trend. Normally, a price trend can be in a Trending Phase or a Congestion
// Phase/Choppy Movement Phase. Adam White created this particular Technical Indicator
// to determine whether prices are trending in a particular direction or are they going
// through a transitional period. He used it to measure the range of Futures available
// in the market.
//
// You can change long to short in the Input Settings
// WARNING:
//  - For purpose educate only
//  - This script to change bars colors.
////////////////////////////////////////////////////////////
strategy(title="Vertical Horizontal Filter Backtest")
Length = input(28, minval=1)
Signal = input(0.4, step=0.01)
reverse = input(false, title="Trade reverse")
hline(Signal, color=blue, linestyle=line)
xHH = highest(high, Length)
xLL = lowest(low, Length)
xNumerator = abs(xHH - xLL)
xDenominator = sum(abs(close - close[1]), Length)
xVHF = xNumerator / xDenominator
pos = iff(xVHF > Signal, 1,
       iff(xVHF < Signal, -1, nz(pos[1], 0)))
possig = iff(reverse and pos == 1, -1,
          iff(reverse and pos == -1, 1, pos))
if (possig == 1)
    strategy.entry("Long", strategy.long)
if (possig == -1)
    strategy.entry("Short", strategy.short)
barcolor(possig == -1 ? red: possig == 1 ? green : blue )
plot(xVHF, color=blue, title="VHF")