概述
该策略运用两个不同参数的移动平均线,快速移动平均线和慢速移动平均线。当快速移动平均线从下方上穿慢速移动平均线时,产生买入信号;当快速移动平均线从上方下穿慢速移动平均线时,产生卖出信号。同时,如果慢速移动平均线从下方上穿快速移动平均线,也会产生卖出信号,平仓所有头寸。
策略原理
该策略的核心逻辑基于移动平均线的黄金交叉原理。所谓的黄金交叉是指短期移动平均线上穿长期移动平均线,被视为市场行情反转的信号,通常预示着股价上涨。而死亡交叉则是短期移动平均线下穿长期移动平均线,预示着股价下跌。
具体来说,该策略定义了两个移动平均线,快速移动平均线长度为10天,慢速移动平均线长度为30天。在每根K线结束的时候,计算这两个移动平均线的值。如果发生快速移动平均线上穿慢速移动平均线的情况,就生成买入信号;如果发生快速移动平均线下穿慢速移动平均线的情况,就生成卖出信号。
为了及时止损,如果发生慢速移动平均线上穿快速移动平均线的情况,也会生成卖出信号,直接平仓所有头寸。
策略优势分析
该策略具有以下优势:
使用了移动平均线的黄金交叉理论,这是一种简单有效的技术指标交易策略。
快速移动平均线参数为10天,能够快速响应价格变动;慢速移动平均线参数为30天,能够有效过滤市场噪音。
策略加入了止损机制,如果发生不利形态,会快速止损,有效控制风险。
该策略逻辑简单,容易理解和实现,适合量化交易的自动执行。
指标参数可以灵活调整,用于适应不同品种的交易。
风险分析
尽管该策略具有明显的优势,但也存在一定的风险需要注意:
如果行情出现长期趋势市场,该策略可能会产生频繁的错误信号。可以通过调整移动平均线参数来优化。
移动平均线本身具有滞后的特点,可能导致信号产生有些滞后。
单一指标策略容易受到误导,应该结合其他因素来决定最终的入场。
停损点设置得不当可能造成不必要的损失。应该针对不同品种设置合理的止损位置。
策略优化方向
该策略还有进一步优化的空间:
可以测试更多组合的参数,找到最佳的快速移动平均线和慢速移动平均线的长度。
可以加入其它指标的确认,例如交易量,布林带等,以提高信号的准确性。
可以根据市场行情的不同状态使用自适应移动平均线,实时优化参数。
可以设立滑点控制,避免高波动时的不必要滑点损失。
可以加入自动止损策略,根据ATR动态设置止损位。
总结
本策略运用简单的双移动平均线黄金交叉理论,为量化交易提供了一套简单实用的技术指标交易策略。该策略易于理解和实现,经过参数优化可以适用于不同品种和行情环境,值得量化投资者关注和测试。
总的来说,移动平均线策略具有概率优势,配合严格的风险控制,具有长期盈利的可能。但交易者也需要意识到其局限性,在使用时应该灵活应用,并辅以其他分析工具。
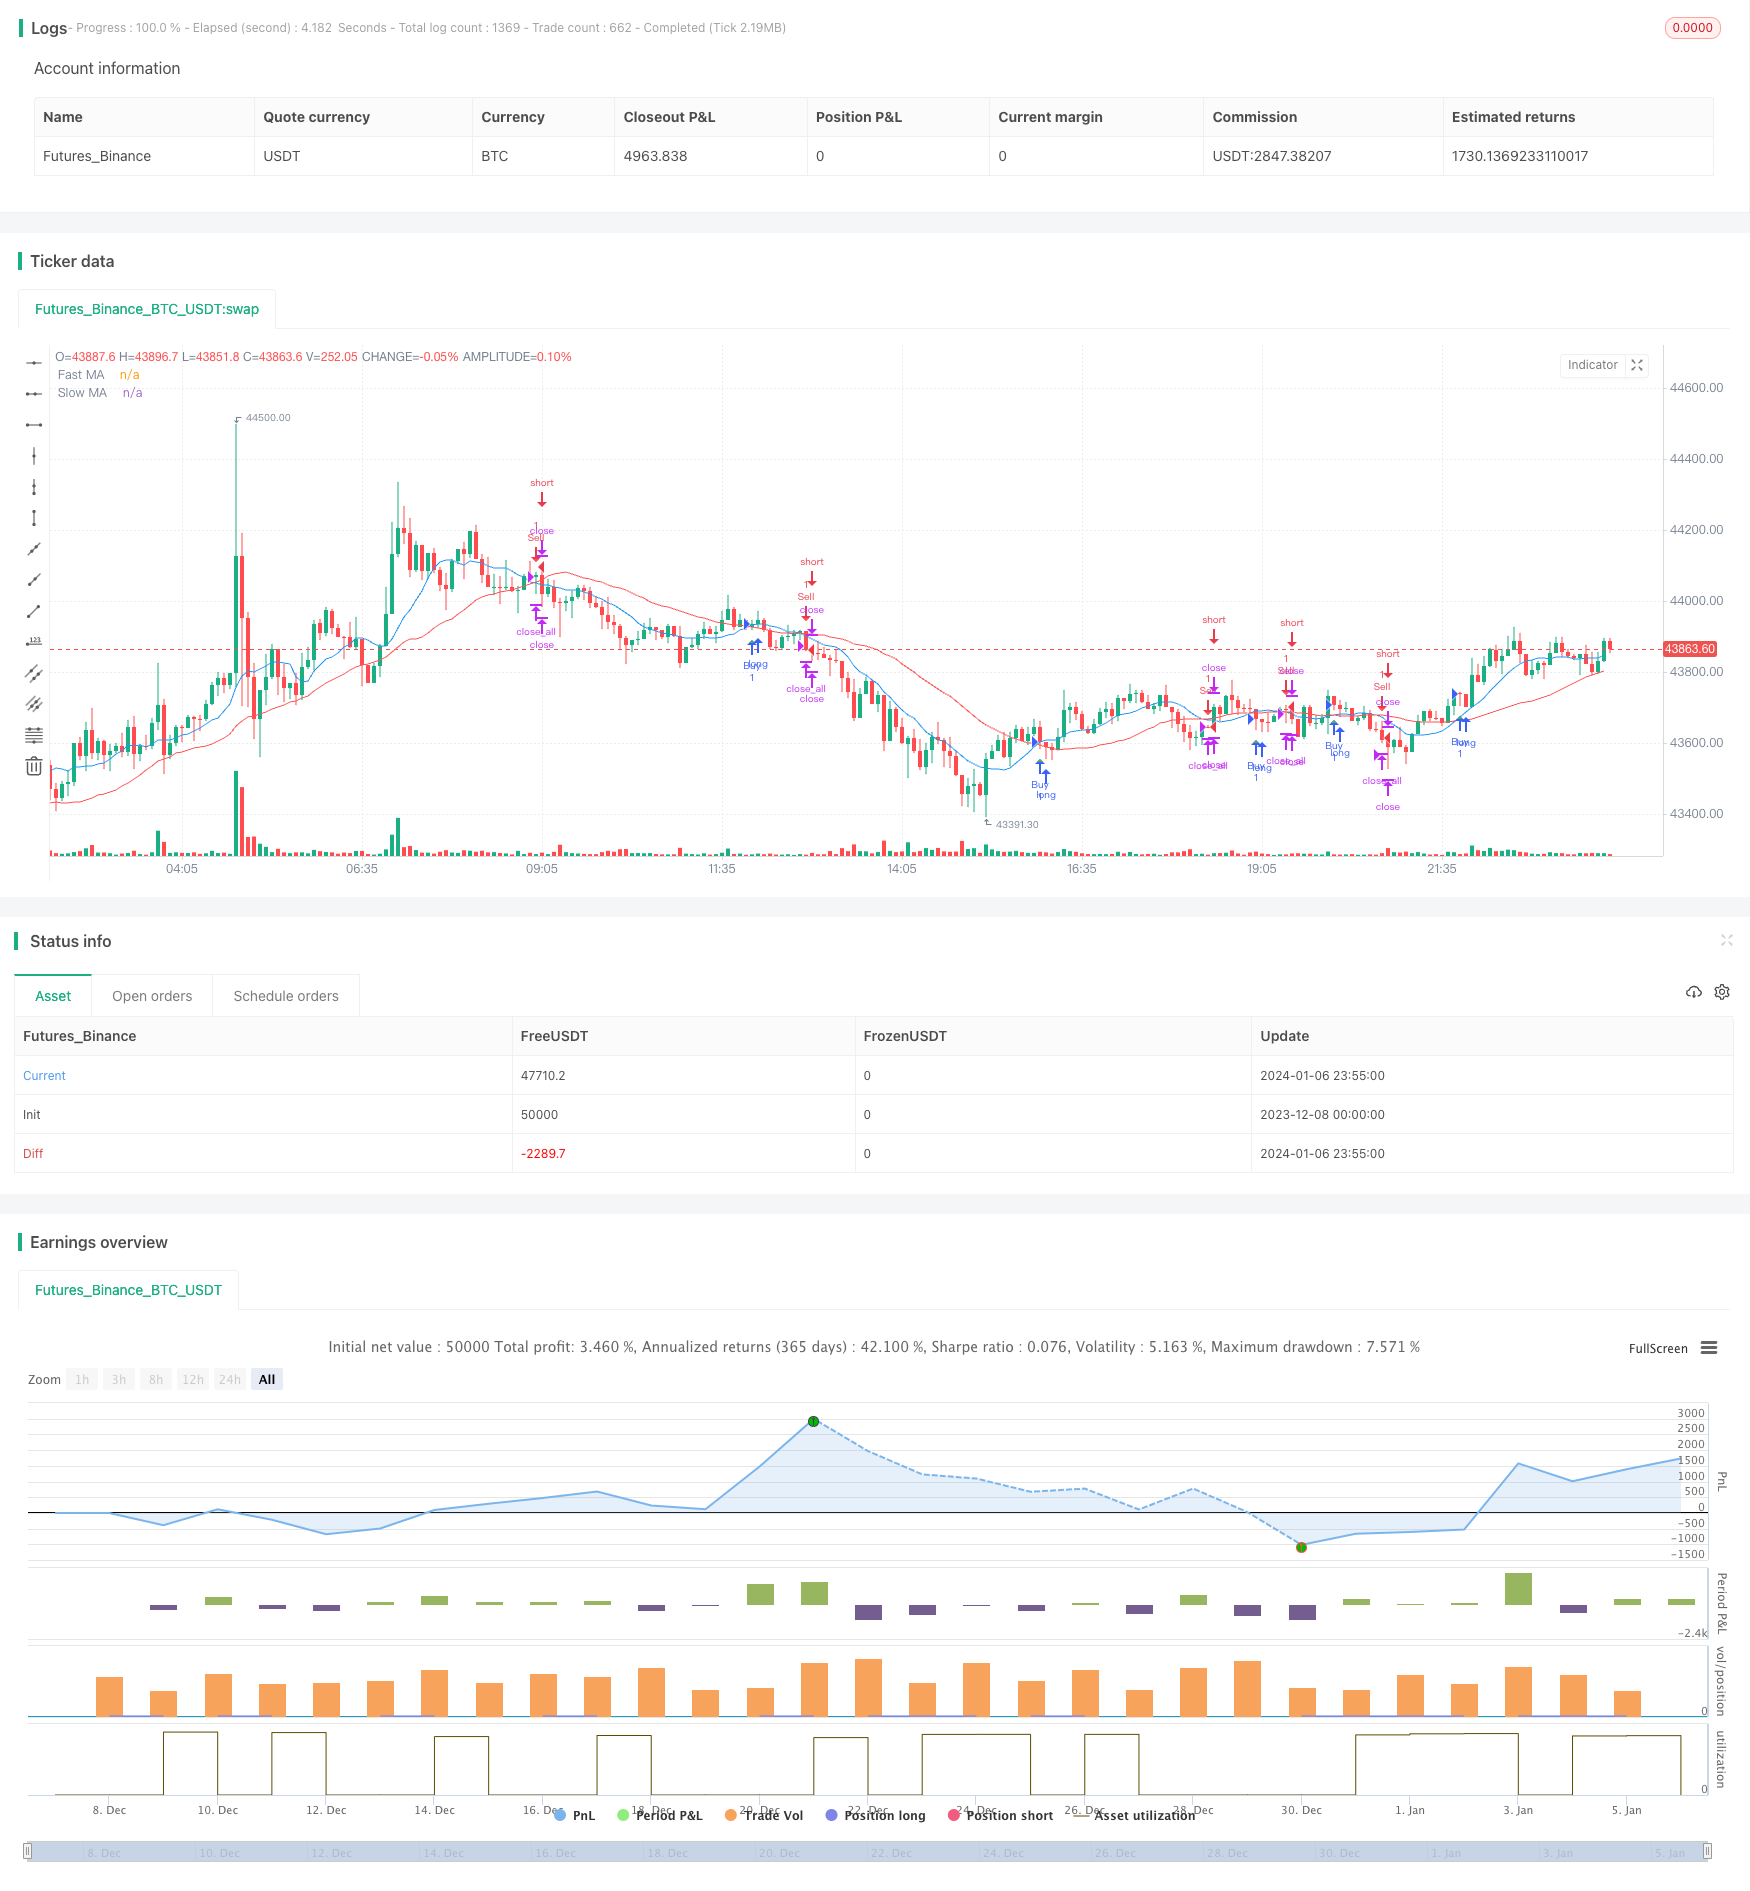
/*backtest
start: 2023-12-08 00:00:00
end: 2024-01-07 00:00:00
period: 5m
basePeriod: 1m
exchanges: [{"eid":"Futures_Binance","currency":"BTC_USDT"}]
*/

//@version=5
strategy("Crude Oil Moving Average Crossover", overlay=true)

// Define inputs
fastLength = input(10, "Fast Length")
slowLength = input(30, "Slow Length")

// Calculate moving averages
fastMA = ta.sma(close, fastLength)
slowMA = ta.sma(close, slowLength)

// Plot moving averages
plot(fastMA, color=color.blue, title="Fast MA")
plot(slowMA, color=color.red, title="Slow MA")

// Entry conditions
longCondition = ta.crossover(fastMA, slowMA)
shortCondition = ta.crossunder(fastMA, slowMA)

// Exit conditions
exitCondition = ta.crossover(slowMA, fastMA)

// Execute strategy
if longCondition
    strategy.entry("Buy", strategy.long)
if shortCondition
    strategy.entry("Sell", strategy.short)
if exitCondition
    strategy.close_all()

// Plot buy and sell signals
plotshape(longCondition, title="Buy Signal", location=location.belowbar, color=color.green, style=shape.triangleup, size=size.small)
plotshape(shortCondition, title="Sell Signal", location=location.abovebar, color=color.red, style=shape.triangledown, size=size.small)