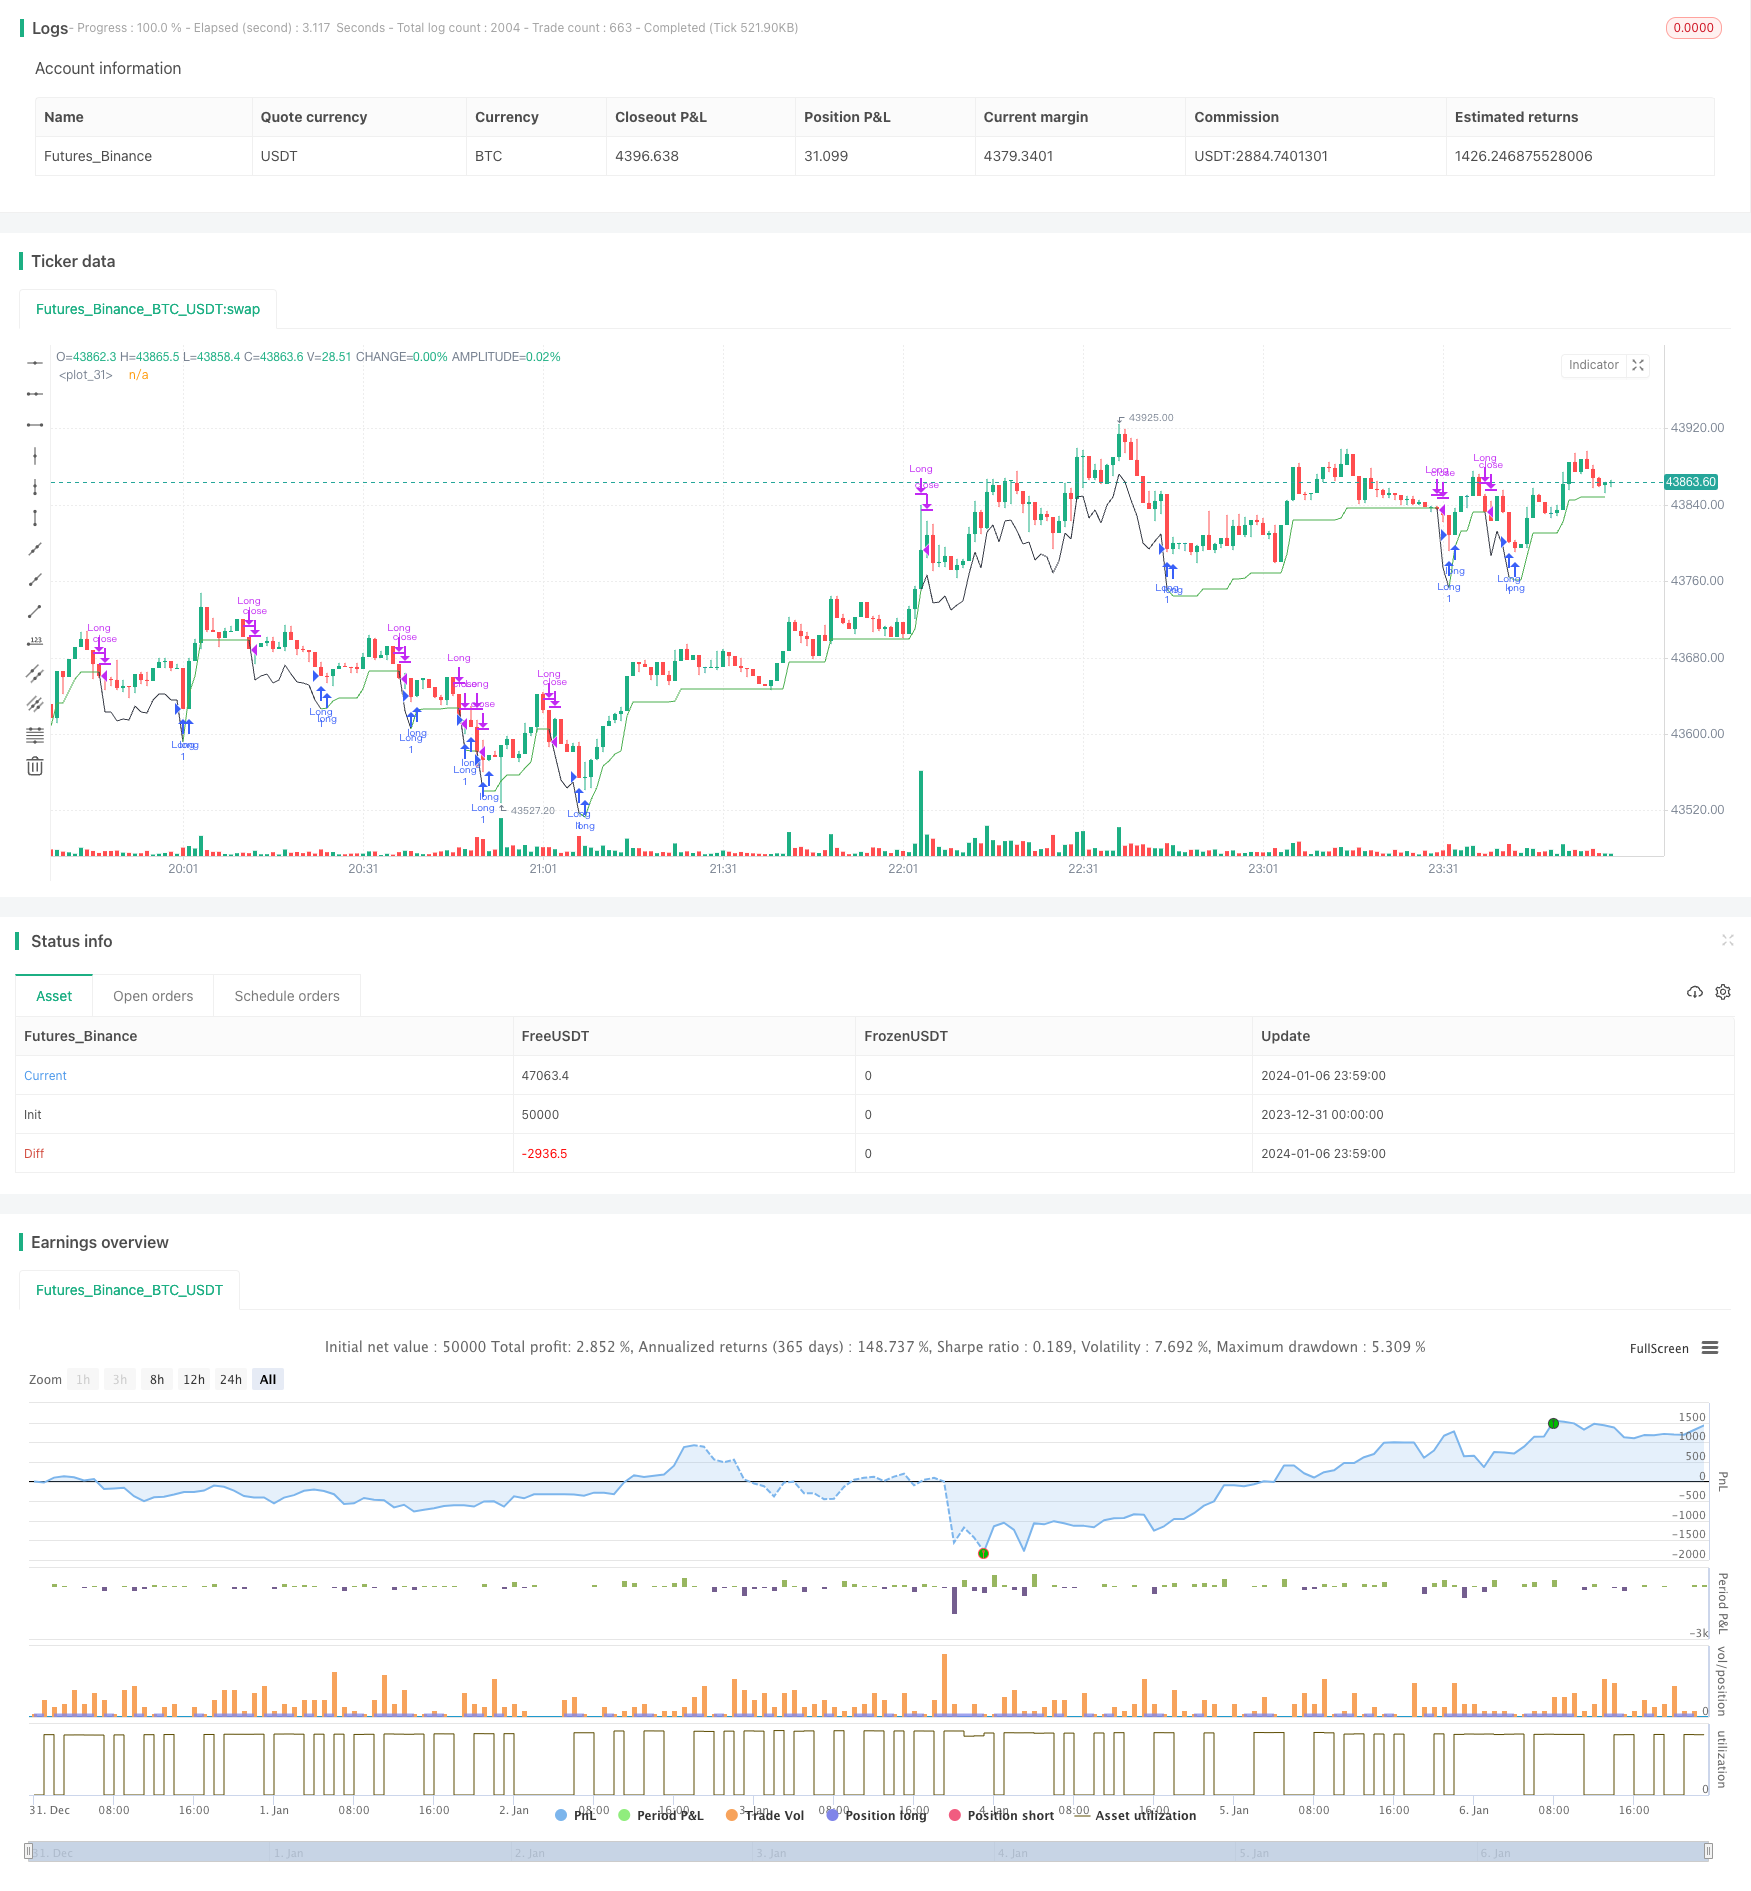
概述
本策略名称为“基于RSI指标的双轨突破策略”。该策略利用RSI指标的双轨配合进行判断,实现低买高卖的目的。当RSI指标低于设置的低轨(默认40)时视为买入信号,此时若RSI10小于RSI14则进一步确认买入;当RSI指标高于设置的高轨(默认70)时视为卖出信号,此时若RSI10高于RSI14则进一步确认卖出。该策略同时设置了移动止损和止盈退出机制。
策略原理
本策略的核心逻辑是利用RSI指标的双轨进行判断。RSI指标一般设置为14周期,代表了近14天的股票强弱情况。本策略则添加了RSI10作为辅助判断指标。
当RSI14下破40轨时,认为股价跌破弱势面,有可能形成支撑反弹的机会。此时若RSI10小于RSI14,说明短期趋势依然向下,可以进一步确认看跌信号。所以满足“RSI14 <= 40且RSI10 < RSI14”时则产生买入信号。
当RSI14上破70轨时,认为股价进入短期的强势区域,有可能出现回落调整的机会。此时若RSI10大于RSI14,说明短期趋势继续向上,可以进一步确认看涨信号。所以满足“RSI14 >= 70且RSI10 > RSI14”时则产生卖出信号。
这样,RSI14和RSI10的配合判断,构成了双轨策略的核心逻辑。
策略优势
- 使用双RSI指标组合判断,可以更准确捕捉买卖点位
- 采用移动止损机制,可以及时止损,控制最大亏损
- 设置止盈退出机制,可以在达到目标利润后退出,避免盈利回吐
策略风险
- RSI指标容易产生虚假信号,无法完全避免亏损的发生
- 止损点设置过于接近可能会被秒出,设置过大又难以控制风险
- 如果行情异常,如快速跳空,也会招致相应损失
要充分利用该策略,可以适当调整RSI参数,严格控制止损位置,避免操作过于密集,追求稳定持久的盈利能力。
策略优化方向
- 可以考虑结合其他指标进行组合,如KDJ、MACD等,实现多指标验证
- 可以针对不同品种分别设置RSI参数,使参数更贴近该品种特点
- 可以设置动态止损,根据ATR等指标实时调整止损位
- 可以通过机器学习技术自动优化RSI参数
总结
本策略基于RSI的双轨思路进行判断,在一定程度上过滤了部分噪音信号。但任何单一指标策略都无法完美,RSI指标容易产生误导,应谨慎看待。本策略中加入了移动止损和止盈机制来控制风险,这是非常必要的。未来可继续优化,使策略参数和止损方式更加智能化、动态化。
策略源码
/*backtest
start: 2023-12-31 00:00:00
end: 2024-01-07 00:00:00
period: 1m
basePeriod: 1m
exchanges: [{"eid":"Futures_Binance","currency":"BTC_USDT"}]
*/

// This source code is subject to the terms of the Mozilla Public License 2.0 at https://mozilla.org/MPL/2.0/
// © DojiEmoji

//@version=4
strategy("[KL] RSI 14 + 10 Strategy",overlay=true)

backtest_timeframe_start = input(defval = timestamp("01 Jan 2015 13:30 +0000"), title = "Backtest Start Time", type = input.time)
//backtest_timeframe_end = input(defval = timestamp("19 Mar 2021 19:30 +0000"), title = "Backtest End Time", type = input.time)
TARGET_PROFIT_MODE = input(false,title="Exit when Risk:Reward met")
REWARD_RATIO = input(3,title="Risk:[Reward] (i.e. 3) for exit")
// Trailing stop loss {
TSL_ON = input(true,title="Use trailing stop loss")
var entry_price = float(0)
ATR_multi_len = 26
ATR_multi = input(2, "ATR multiplier for stop loss")
ATR_buffer = atr(ATR_multi_len) * ATR_multi
plotchar(ATR_buffer, "ATR Buffer", "", location = location.top)
risk_reward_buffer = (atr(ATR_multi_len) * ATR_multi) * REWARD_RATIO
take_profit_long = low > entry_price + risk_reward_buffer
take_profit_short = low < entry_price - risk_reward_buffer
var bar_count = 0 //number of bars since entry
var trailing_SL_buffer = float(0)
var stop_loss_price = float(0)
stop_loss_price := max(stop_loss_price, close - trailing_SL_buffer)
// plot TSL line
trail_profit_line_color = color.green
showLine = strategy.position_size == 0
if showLine
    trail_profit_line_color := color.black
    stop_loss_price := close - trailing_SL_buffer
plot(stop_loss_price,color=trail_profit_line_color)
// }
// RSI
RSI_LOW = input(40,title="RSI entry")
RSI_HIGH = input(70,title="RSI exit")
rsi14 = rsi(close, 14)
rsi10 = rsi(close, 10)

if true// and time <= backtest_timeframe_end
    buy_condition = rsi14 <= RSI_LOW and rsi10 < rsi14
    exit_condition = rsi14 >= RSI_HIGH and rsi10 > rsi14
    //ENTRY:
    if strategy.position_size == 0 and buy_condition
        entry_price := close
        trailing_SL_buffer := ATR_buffer
        stop_loss_price := close - ATR_buffer
        strategy.entry("Long",strategy.long, comment="buy")
        bar_count := 0
    else if strategy.position_size > 0
        bar_count := bar_count + 1

    //EXIT:
    // Case (A) hits trailing stop
    if TSL_ON and strategy.position_size > 0 and close <= stop_loss_price
        if close > entry_price
            strategy.close("Long", comment="take profit [trailing]")
            stop_loss_price := 0
        else if close <= entry_price and bar_count
            strategy.close("Long", comment="stop loss")
            stop_loss_price := 0
        bar_count := 0
    // Case (B) take targeted profit relative to risk
    if strategy.position_size > 0 and TARGET_PROFIT_MODE
        if take_profit_long
            strategy.close("Long", comment="take profits [risk:reward]")
            stop_loss_price := 0
        bar_count := 0
    // Case (C)
    if strategy.position_size > 0 and exit_condition
        if take_profit_long
            strategy.close("Long", comment="exit[rsi]")
            stop_loss_price := 0
        bar_count := 0