概述
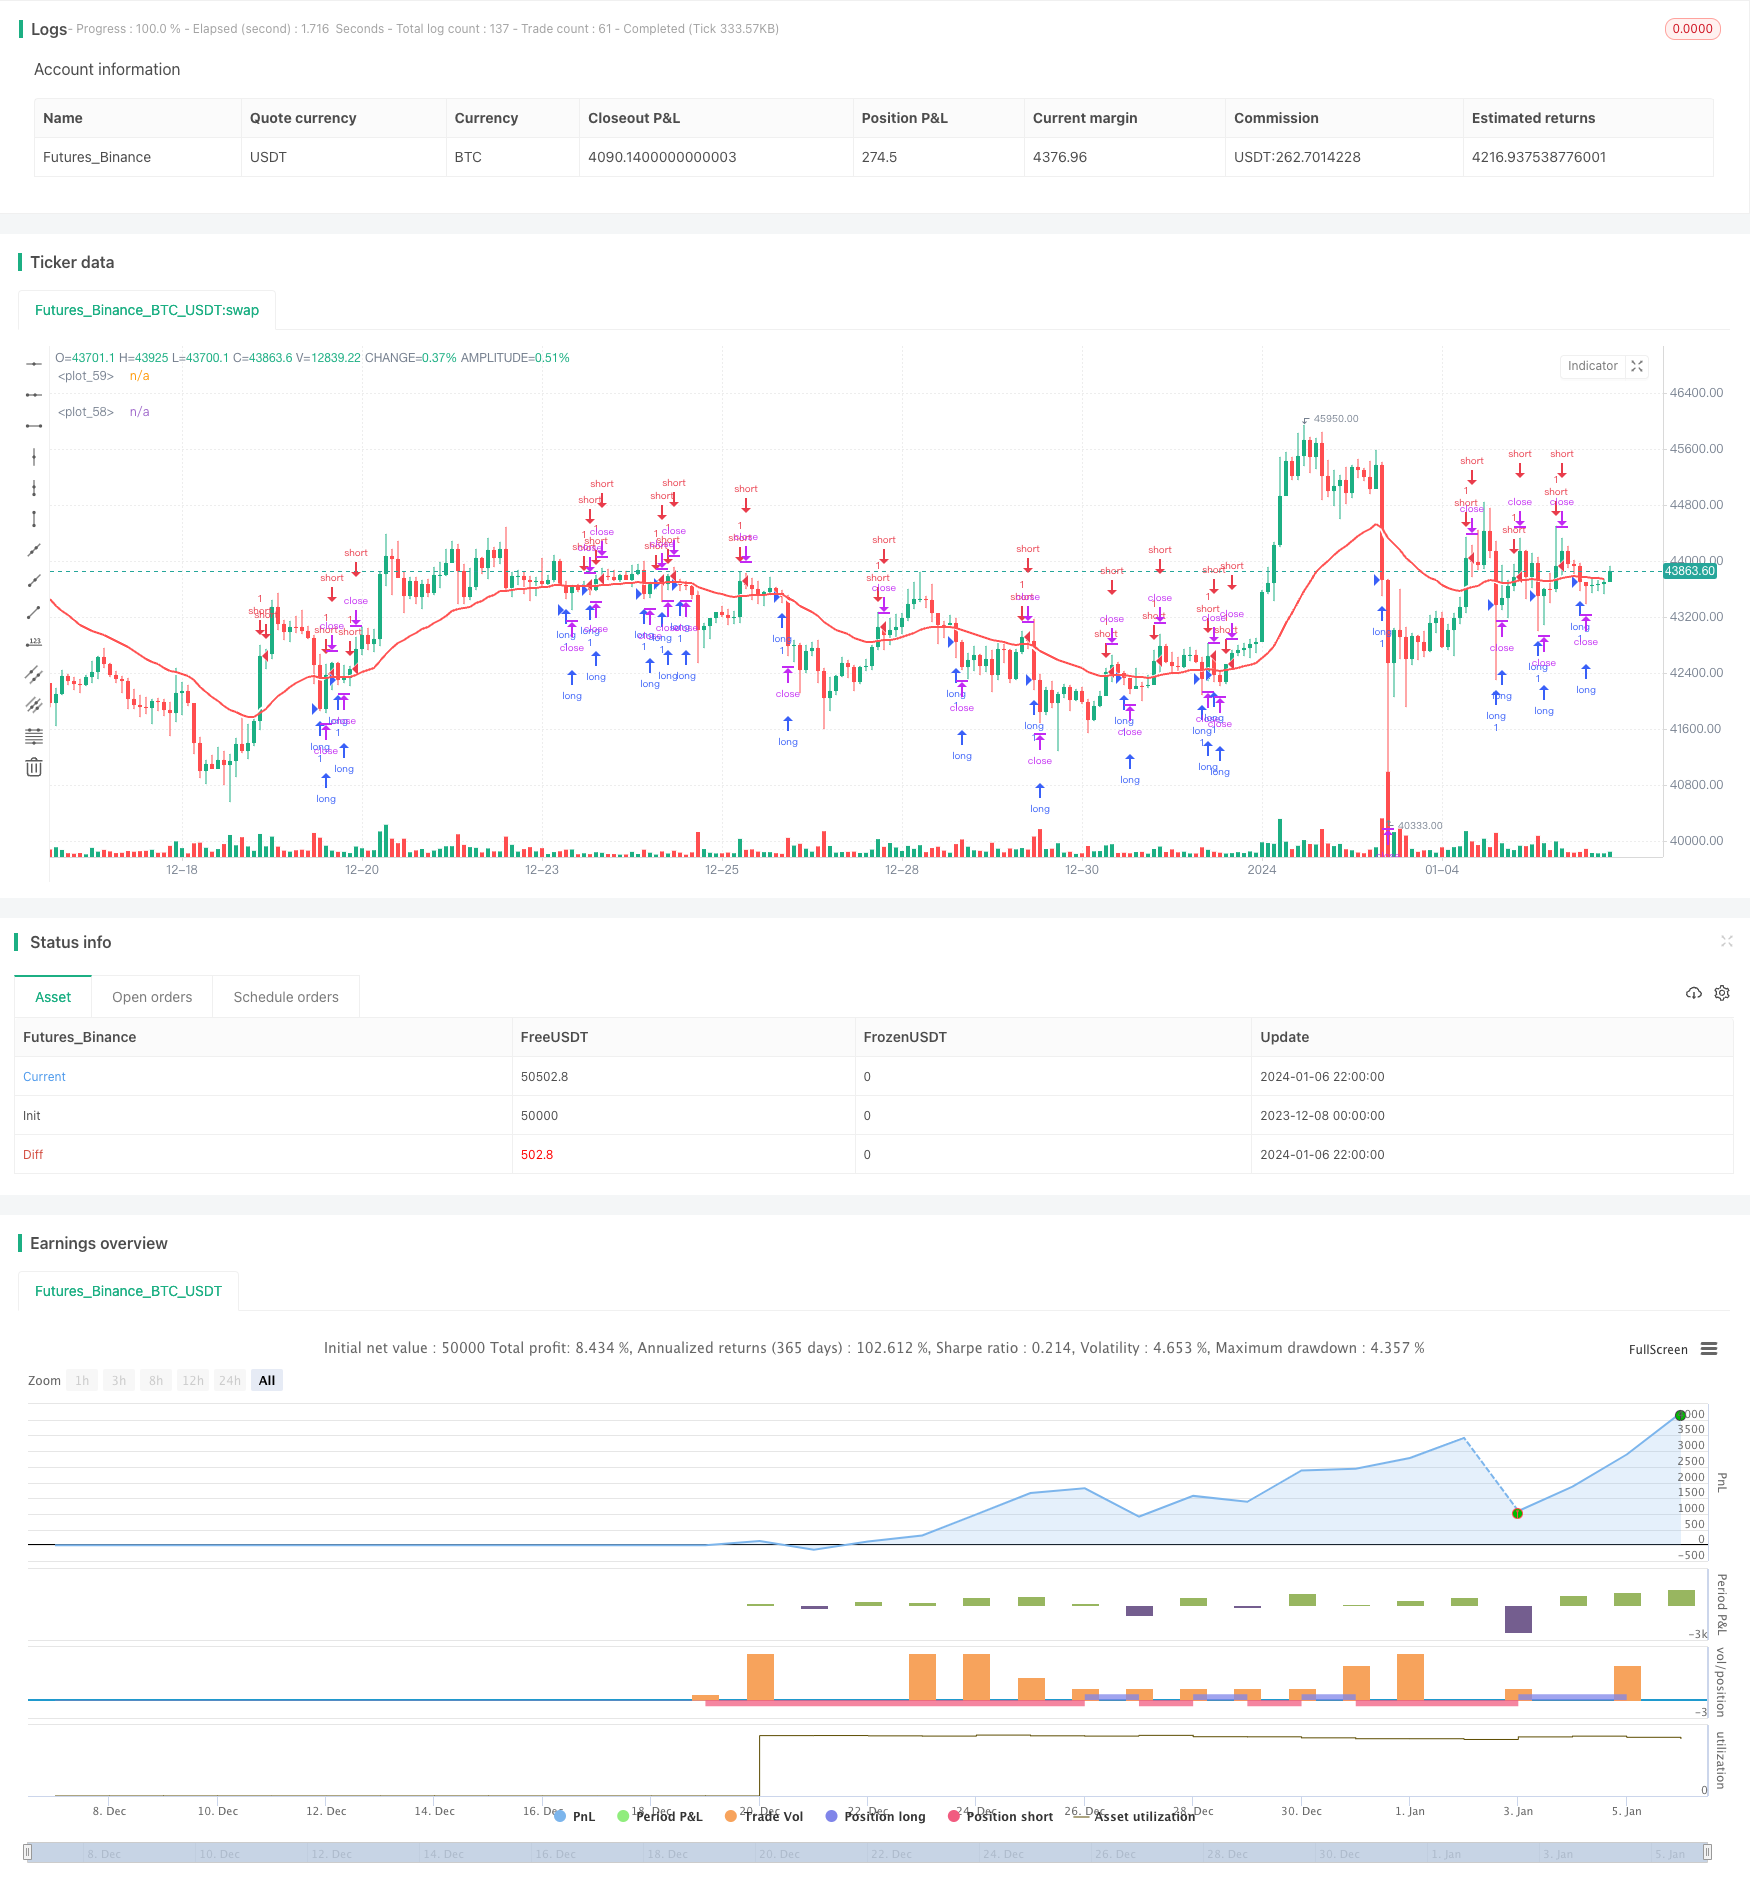
双移动平均反转趋势策略是一种主要用于外汇市场中期交易的策略。该策略使用两个不同周期的移动平均线进行交易信号生成。当快速移动平均线和慢速移动平均线发生黄金交叉时,采取做空头寻求反转;当快速移动平均线和慢速移动平均线发生死叉时,采取做多头寻求反转。
策略原理
该策略使用1小时和1日两个时间周期的移动平均线。1小时周期的移动平均线反应价格变化更加灵敏,可以作为快速移动平均线;1日周期的移动平均线对价格变化响应更慢,可以作为慢速移动平均线。当快速移动平均线上穿慢速移动平均线时,认为目前处于多头市场,将产生做空信号;当快速移动平均线下穿慢速移动平均线时,认为目前处于空头市场,将产生做多信号。
进入做多或做空头寻求反转的原理是,当快速移动平均线和慢速移动平均线发生黄金交叉或死叉时,表示市场可能产生了转折,快速线上穿或下穿慢速线就是产生反转信号的时机。根据反转交易理论,价格通常不会单向上涨或下跌,当出现突破或重要支撑与阻力位后,很有可能是股价反转的时刻。所以该策略利用双移动平均线反转信号来捕捉反转机会。
该策略还设定了交易时间和日期筛选条件,只有在设定的日期范围内且处于设定的交易时段内时,才会进行交易,避免在不适宜的时间段进行交易。
优势分析
双移动平均反转趋势策略具有以下优势:
反转策略具有获利空间大的优点。反转交易通过在关键点位做反向操作,能够在价格波动较大的行情中获得更高的盈利。
使用双移动平均线组合过滤信号,避免假信号。单一指标容易产生假信号,而双指标组合能够提高信号的可靠性,过滤掉一些假信号,使得交易机会更加可靠。
设定交易时间和日期条件,避开市场不活跃期,避免受困。只在设定的交易时段和日期范围内交易,可以避开价格剧烈波动的时间段,避免交易受阻。
反转策略适合中期交易。相比高频交易,中期交易策略更加稳定,避免过于频繁地进行买卖。
最大回撤控制有利于资金管理。设置最大回撤比例可以很好地控制 overnight 风险,避免资金大幅度损失。
风险分析
双移动平均反转趋势策略也存在以下风险:
反转信号可能失效导致亏损。价格反转信号并不总是可靠的,当价格继续走势而没有反转时,将面临亏损风险。可以设置止损来控制损失。
趋势偏离带来亏损。当双移动平均已经明显分离时再做反转,可能会面临亏损风险。可以通过观察移动平均线间距来决定反转时机。
交易时段设置不当可能错过机会。如果交易时段设置得过于严格,可能会错过一些交易机会。可以适当扩大交易时段。
反转后无法及时止损亏损扩大。在反转后价格继续原趋势运行时,必须及时止损来控制损失。
优化方向
双移动平均反转趋势策略还可以从以下方面进行优化:
测试更多指标的组合,寻找更好的交易信号。可以测试MACD,KDJ等其他指标与双移动平均线进行组合,提高信号的准确性。
优化移动平均线的周期参数,找到最佳参数。可以通过回测移动平均线不同长度的参数,确定最佳周期数。
扩大或缩小交易时间,找到最佳交易时段。根据不同品种特点,测试调整交易时间段的效果。
增加趋势过滤条件,避免偏离。可以增加类似ADX等指标来判断趋势强弱,避免在无明显趋势时做反转。
增加机器学习模型进行信号检验。可以训练模型判断反转信号的可靠性,过滤掉一些低质量信号。
总结
双移动平均反转趋势策略,是一种适合外汇中期交易的策略。它使用快速移动平均线和慢速移动平均线的黄金交叉与死叉产生反转信号,在市场关键点位进行反向操作,具有获利空间大的优点。同时它还使用了交易时段和最大回撤的设置来控制风险。这是一个较为稳定的反转系统,既能产生较高收益,也能控制风险。未来该策略还可以通过指标和参数的优化,以及增加机器学习模型的应用等方式进行提升与优化。
/*backtest
start: 2023-12-08 00:00:00
end: 2024-01-07 00:00:00
period: 2h
basePeriod: 15m
exchanges: [{"eid":"Futures_Binance","currency":"BTC_USDT"}]
*/

// This source code is subject to the terms of the Mozilla Public License 2.0 at https://mozilla.org/MPL/2.0/
// © SoftKill21

//@version=4
strategy("gbpnzd 1h", overlay=true)

src = close
useCurrentRes = input(true, title="Use Current Chart Resolution?")
resCustom = input(title="Use Different Timeframe? Uncheck Box Above", type=input.resolution, defval="60")
len = input(28, title="Moving Average Length - LookBack Period")
//periodT3 = input(defval=7, title="Tilson T3 Period", minval=1)
factorT3 = input(defval=7, title="Tilson T3 Factor - *.10 - so 7 = .7 etc.", minval=0)
atype = input(2,minval=1,maxval=8,title="1=SMA, 2=EMA, 3=WMA, 4=HullMA, 5=VWMA, 6=RMA, 7=TEMA, 8=Tilson T3")

fromDay = input(defval = 1, title = "From Day", minval = 1, maxval = 31)
fromMonth = input(defval = 1, title = "From Month", minval = 1, maxval = 12)
fromYear = input(defval = 2000, title = "From Year", minval = 1970)
 //monday and session
// To Date Inputs
toDay = input(defval = 31, title = "To Day", minval = 1, maxval = 31)
toMonth = input(defval = 12, title = "To Month", minval = 1, maxval = 12)
toYear = input(defval = 2020, title = "To Year", minval = 1970)

startDate = timestamp(fromYear, fromMonth, fromDay, 00, 00)
finishDate = timestamp(toYear, toMonth, toDay, 00, 00)
time_cond = true

res = useCurrentRes ? timeframe.period : resCustom
resCustom2 = input(title="plm", type=input.resolution, defval="D")
res2 = resCustom2
//hull ma definition
hullma = wma(2*wma(src, len/2)-wma(src, len), round(sqrt(len)))
//TEMA definition
ema1 = ema(src, len)
ema2 = ema(ema1, len)
ema3 = ema(ema2, len)
tema = 3 * (ema1 - ema2) + ema3

//Tilson T3
factor = factorT3 *.10
gd(src, len, factor) => ema(src, len) * (1 + factor) - ema(ema(src, len), len) * factor
t3(src, len, factor) => gd(gd(gd(src, len, factor), len, factor), len, factor)
tilT3 = t3(src, len, factor)


avg = atype == 1 ? sma(src,len) : atype == 2 ? ema(src,len) : atype == 3 ? wma(src,len) : atype == 4 ? hullma : atype == 5 ? vwma(src, len) : atype == 6 ? rma(src,len) : atype == 7 ? 3 * (ema1 - ema2) + ema3 : tilT3

out = avg

ema20 = security(syminfo.tickerid, res, out)


plot3 = security(syminfo.tickerid, res2, ema20)

plot33 = security(syminfo.tickerid, res, ema20)

plot(plot3,linewidth=2,color=color.red)
plot(plot33,linewidth=2,color=color.white)

// longC = crossover(close[2], plot3) and close[1] > close[2] and close > close[1]
// shortc = crossunder(close[2],plot3)  and close[1] < close[2] and close < close[1]

volumeMA=input(24)
ema_1 = ema(volume, volumeMA)

timeinrange(res, sess) => time(res, sess) != 0
//entrytime = timeinrange(timeframe.period, "0900-0915")

myspecifictradingtimes = input('0900-2300', type=input.session, title="My Defined Hours")


entrytime = time(timeframe.period, myspecifictradingtimes) != 0

longC = crossover(plot33,plot3)  and time_cond and entrytime
shortc = crossunder(plot33,plot3) and time_cond and entrytime

// exitlong = crossunder(plot33,plot3)
// exitshort = crossover(plot33,plot3)

distanta=input(1.0025)
exitshort = plot33/plot3 > distanta
exitlong  = plot3/plot33 > distanta

inverse = input(true)
exit = input(false)
if(inverse==false)

    strategy.entry("long",1,when=longC)
    strategy.entry("short",0,when=shortc)
if(inverse)
    strategy.entry("long",1,when=shortc)
    strategy.entry("short",0,when=longC)

if(exit)
    strategy.close("long",when=exitlong)
    strategy.close("short",when=exitshort)

// if(dayofweek==dayofweek.friday)
//     strategy.close_all()

// risk = input(25)
// strategy.risk.max_intraday_loss(risk, strategy.percent_of_equity)