概述
该策略是基于价格通道原理设计的趋势跟踪策略。它通过计算一定历史周期内的最高价和最低价,形成价格通道,并以通道边界作为买入和卖出信号,实现追踪价格趋势的目的。
策略原理
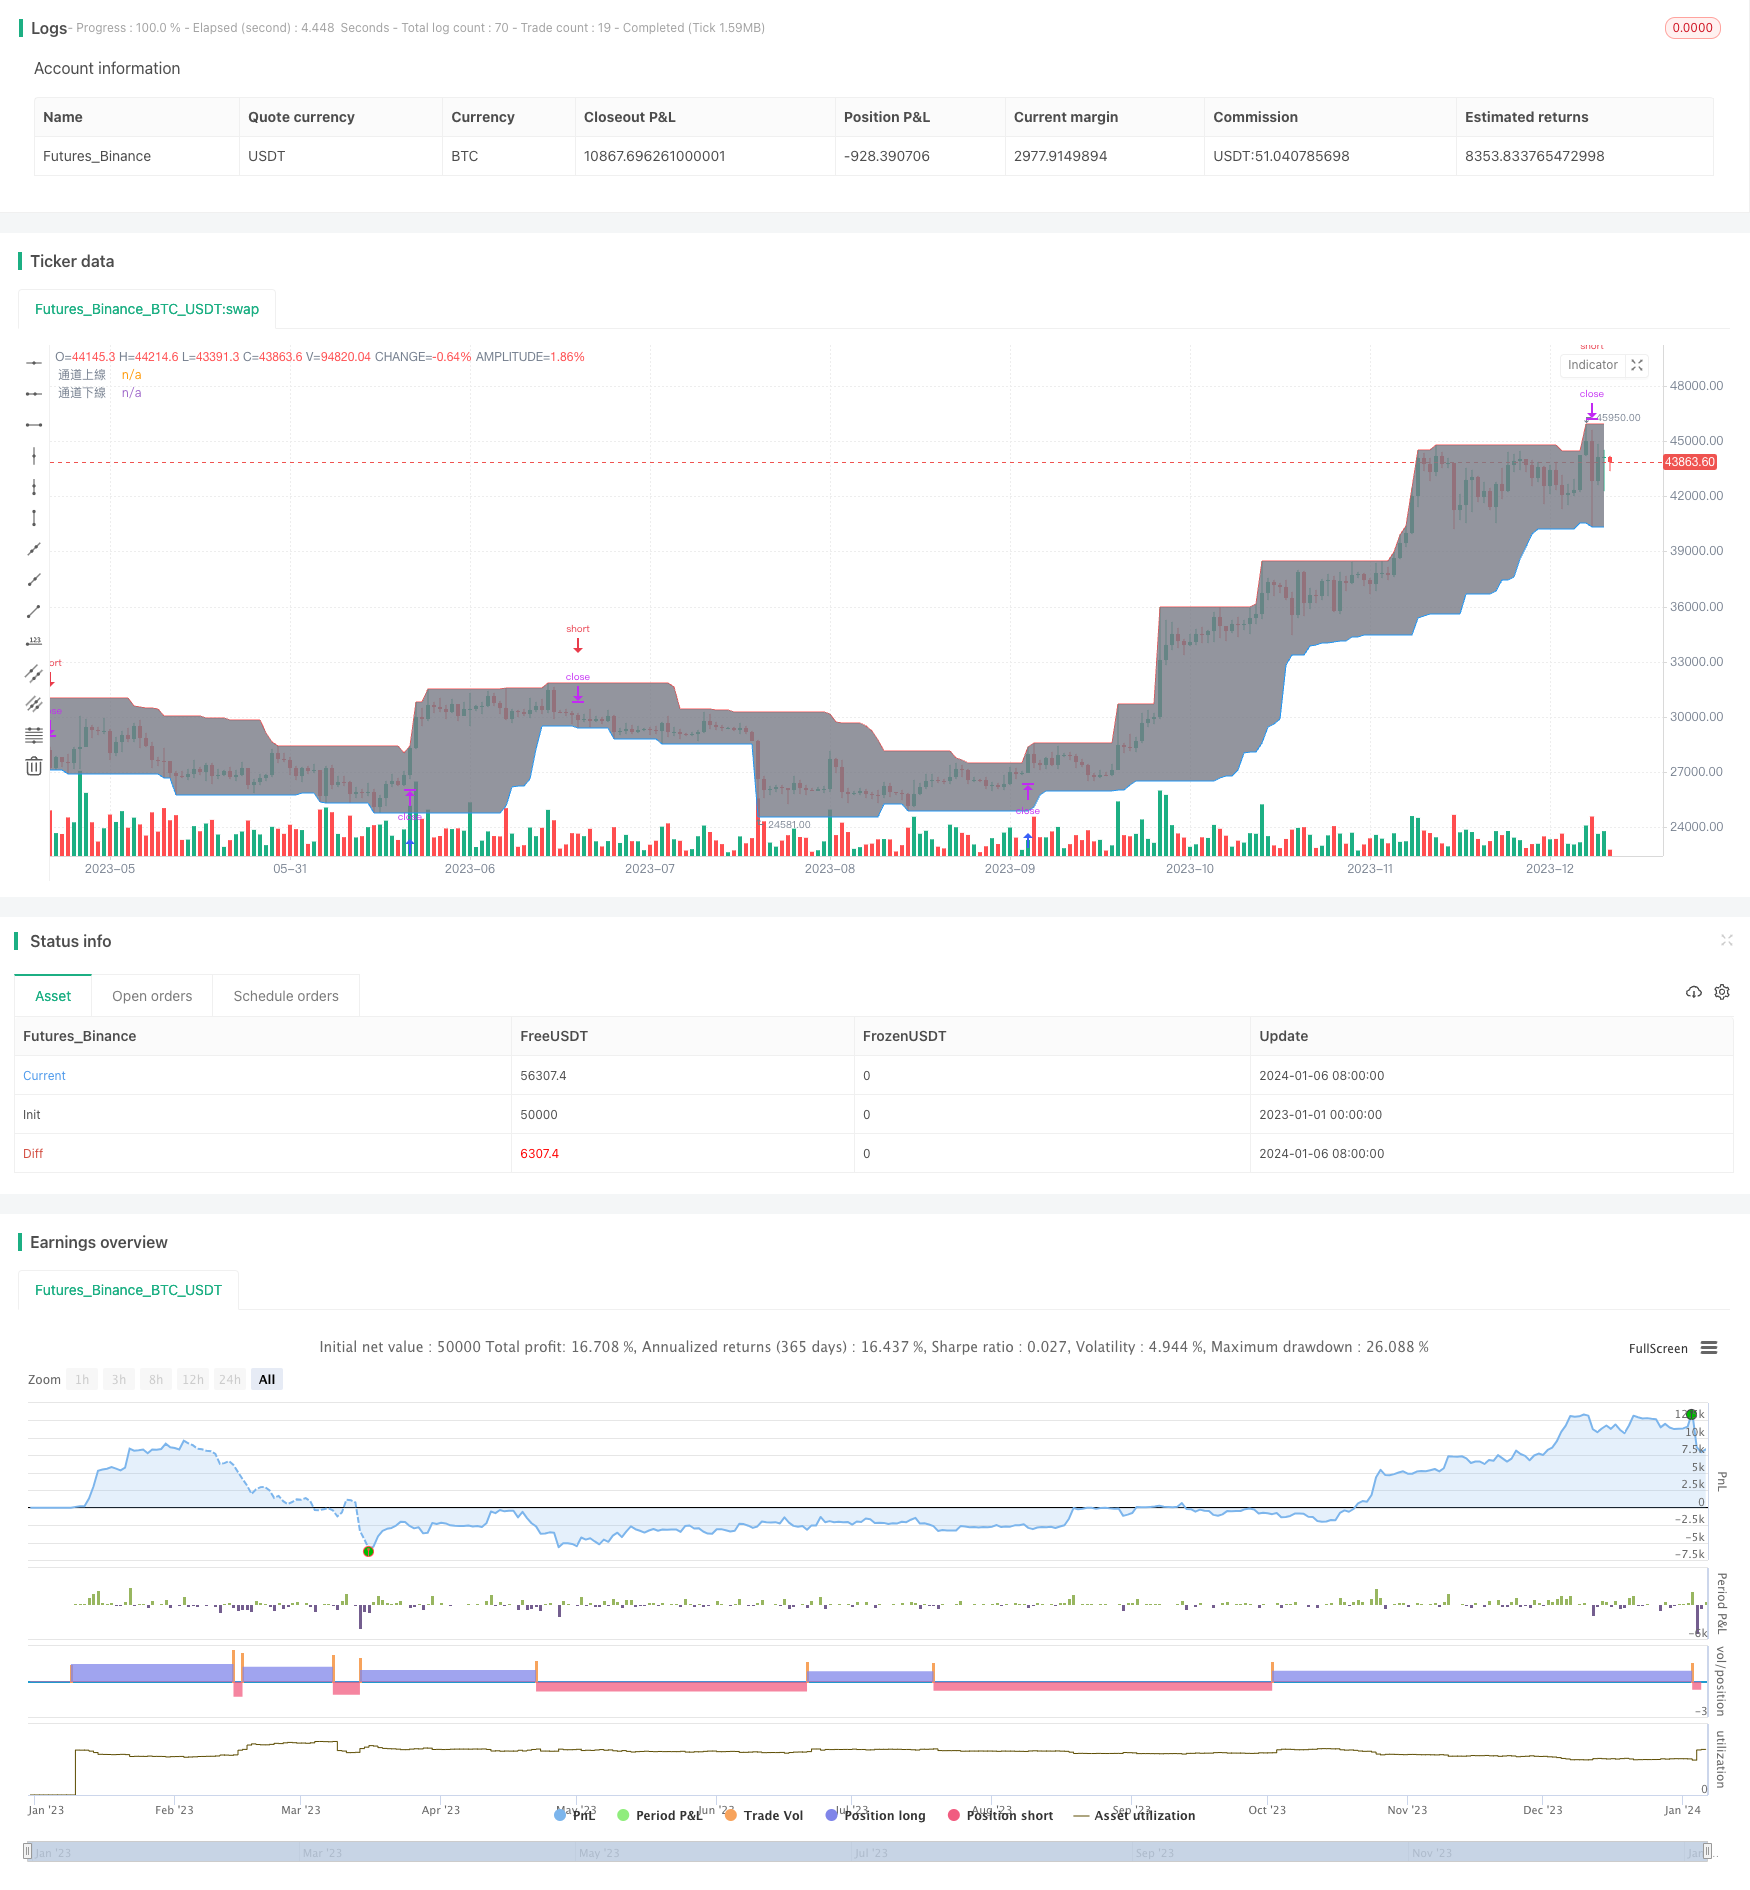
价格通道策略的核心思想是:股价在上涨趋势时会突破历史高点,而在下跌趋势时会突破历史低点。因此,可以根据一定历史周期(如21天)内的最高价和最低价构建价格通道,通道上沿和下沿分别作为买入和卖出信号。
具体来说,该策略通过highest()和lowest()函数计算最近21天的最高价和最低价,形成价格通道。如果当天收盘价高于最近21天最高价(即突破通道上沿),则产生买入信号;如果当天收盘价低于最近21天最低价(即突破通道下沿),则产生卖出信号。
此外,该策略还检查是否有缺口,以判断趋势突变的可能性。如果有向下缺口,为防范风险,会设置价格通道为红色;如果有向上缺口,则设置为绿色。
优势分析
价格通道策略的主要优势有:
- 策略思路简单、易于理解和实现
- 能有效识别股票价格趋势,及时追踪趋势
- 通过突破买入和突破卖出,可以减少交易次数,降低交易成本
- 设置价格通道可以起到止损的作用
- 检查缺口情况,可提示趋势转变
风险分析
该策略也存在一些风险:
- 仅基于价格信息,忽略了其他基本面、技术指标等信息
- 价格通道参数设置不当可能导致过于激进或保守
- 突破买入可能出现回调导致止损
- 未考虑股价波动率和流动性的影响
- 行业、个股特点的差异性没有考虑进去
为了克服这些风险,可以考虑优化如下几个方面:
- 结合关键技术指标判断,避免错误信号
- 加入自适应通道参数算法
- 结合均线系统,判断趋势持续性
- 设置通道宽度因子校正不同波动率
- 区分行业和概念来设定参数
优化方向
该策略还有以下几个主要的优化方向:
- 优化价格通道的参数计算方法,如引入自适应通道、波动率通道等
- 结合其他技术指标判断买入/卖出时机,提高策略效果
- 加入止损和止盈策略,控制风险和锁定利润
- 区分行业和个股特点,设定动态参数
- 结合基本面信息和事件驱动因素提升策略
- 应用机器学习算法实现参数自适应和状况判断
总结
价格通道策略通过简单的历史最高价和最低价构建通道,以通道边界作为交易信号,属于典型的趋势跟踪策略。该策略易于理解和实现,能够有效跟踪价格趋势,且设定价格通道具有止损功能。但该策略也存在一定的风险,主要优化方向包括参数优化、与其他指标结合、止损/止盈、动态参数等。总体而言,价格通道策略为量化交易提供了一个简单实用的趋势跟踪思路,但需要进一步优化和改进才能在实际应用中取得更好效果。
策略源码
/*backtest
start: 2023-01-01 00:00:00
end: 2024-01-07 00:00:00
period: 1d
basePeriod: 1h
exchanges: [{"eid":"Futures_Binance","currency":"BTC_USDT"}]
*/

//@version=4
//
//  作品: [LunaOwl] 樂活投資:價格通道
//  英文: [LunaOwl] LOHAS Investor - PriceChannel
//
///////////////////////////////
//     ~~!!*(๑╹◡╹๑) **      //
//  製作: @LunaOwl 彭彭      //
//  一版: 2019年12月07日     //
//  二版: 2019年12月09日     //
///////////////////////////////
//
//  介紹:
//--價格通道是一個古老的投資策略,對於「肯做功課選股」的上班族投資人非常方便。
//--由於大多數股市散戶沒有時間操作,即時有時間操作也只是加快輸錢的速度,所以,
//--上班族投資法,或「樂活投資」的條件有幾點:
//--**********
//--1) 設定溫和的投資報酬率期望
//--2) 使用適合的選股方式建立投資組合,減少單一股票的失誤率
//--3) 使用簡單的進出場策略,規律的執行它
//--4) 財富依靠時間積累,每天學習
//--**********
//
//==定義回測條件==//

strategy("[LunaOwl] 價格通道",
     initial_capital = 10000, commission_value = 0.07,
     default_qty_type = strategy.percent_of_equity,
     default_qty_value = 50, overlay = true,
     calc_on_order_fills = true
     )

//==設定價格通道==//

Channel_Price  = input(close, title = "通道價格")
Channel_Length = input(21, title = "通道回溯長度")
Channel_High = highest(high, Channel_Length)
Channel_Low  = lowest(low, Channel_Length)

gapUp   = (low > high[1])
gapDown = (high < low[1])

BackgroundColour = (gapUp == true) ? color.green :
                   (gapDown == true) ? color.red : na

bgcolor(BackgroundColour, transp=60)

BorderlineA = plot(Channel_High, title = "通道上線", color = color.red, style = plot.style_line)
BorderlineB = plot(Channel_Low, title = "通道下線", color = color.blue, style = plot.style_line)
fill(BorderlineA, BorderlineB, title = "通道底色", color = color.gray, transp = 85)

Long_entry = close >= Channel_High
Long_close_all = close <= Channel_Low

if (not na(close[Channel_Length]))
    strategy.entry("買入", strategy.long, comment = "高於近期", stop = Channel_High)
    strategy.entry("賣出", strategy.short, comment = "低於近期", stop = Channel_Low)