概述
该策略主要基于RSI指标和布林带指标设计交易规则,实现在趋势市场中获利。当RSI低于超买线而价格接近布林带下轨时做多;当RSI高于超卖线而价格接近布林带上轨时做空,这是该策略的基本交易逻辑。
策略原理
该策略使用RSI指标判断超买超卖区域。RSI低于设定的超买线则为超卖信号,高于超卖线则为超买信号。同时使用布林带指标判断价格突破。当价格由下至上突破布林带下轨时为做多信号,由上至下突破上轨时为做空信号。
该策略综合运用了RSI指标判断市场意愿和布林带判断价格突破两个因素,形成交易决策依据。只有两者同时符合条件时才发出交易信号,可以有效过滤掉一些假信号,提高策略效果。
优势分析
该策略结合RSI和布林带两个指标,可以更准确判断市场走势和捕捉趋势。相比单一指标策略,可以过滤更多假信号,信号质量更高。而RSI指标可以判断超买超卖现象,布林带指标判断价格突破则可以捕捉突破开始的趋势。两者结合使用效果更好。
该策略只在RSI和布林带指标同时发出信号时才开仓,可以有效避免假信号的干扰。同时结合停损来控制风险,即使行情转变也可以及时止损。
风险分析
该策略虽然可以过滤掉一定假信号,但在震荡行情中,RSI和布林带指标可能同时发出错误信号,导致不必要的亏损。此外,参数设置不当也会导致策略效果不佳。
建议通过回测优化参数,寻找最佳参数组合。同时适当调整策略规则,在震荡行情中暂停交易,避免不必要的损失。此外,合理使用止损来控制单笔损失。
优化方向
该策略可以从以下几个方面进行优化:
优化RSI参数和布林带参数,寻找最佳参数组合
增加其他指标作为过滤信号,如MACD、KD等
增加突破验证机制,避免假突破
根据不同行情类型调整参数或停止交易
优化止损策略,实现动态止损
总结
该策略结合RSI指标和布林带指标设计交易规则,只在两者发出同步信号时才开仓,可以有效过滤假信号。通过参数优化、增加信号过滤、止损策略优化等手段,可以不断优化和改进该策略,实现更稳定的盈利。
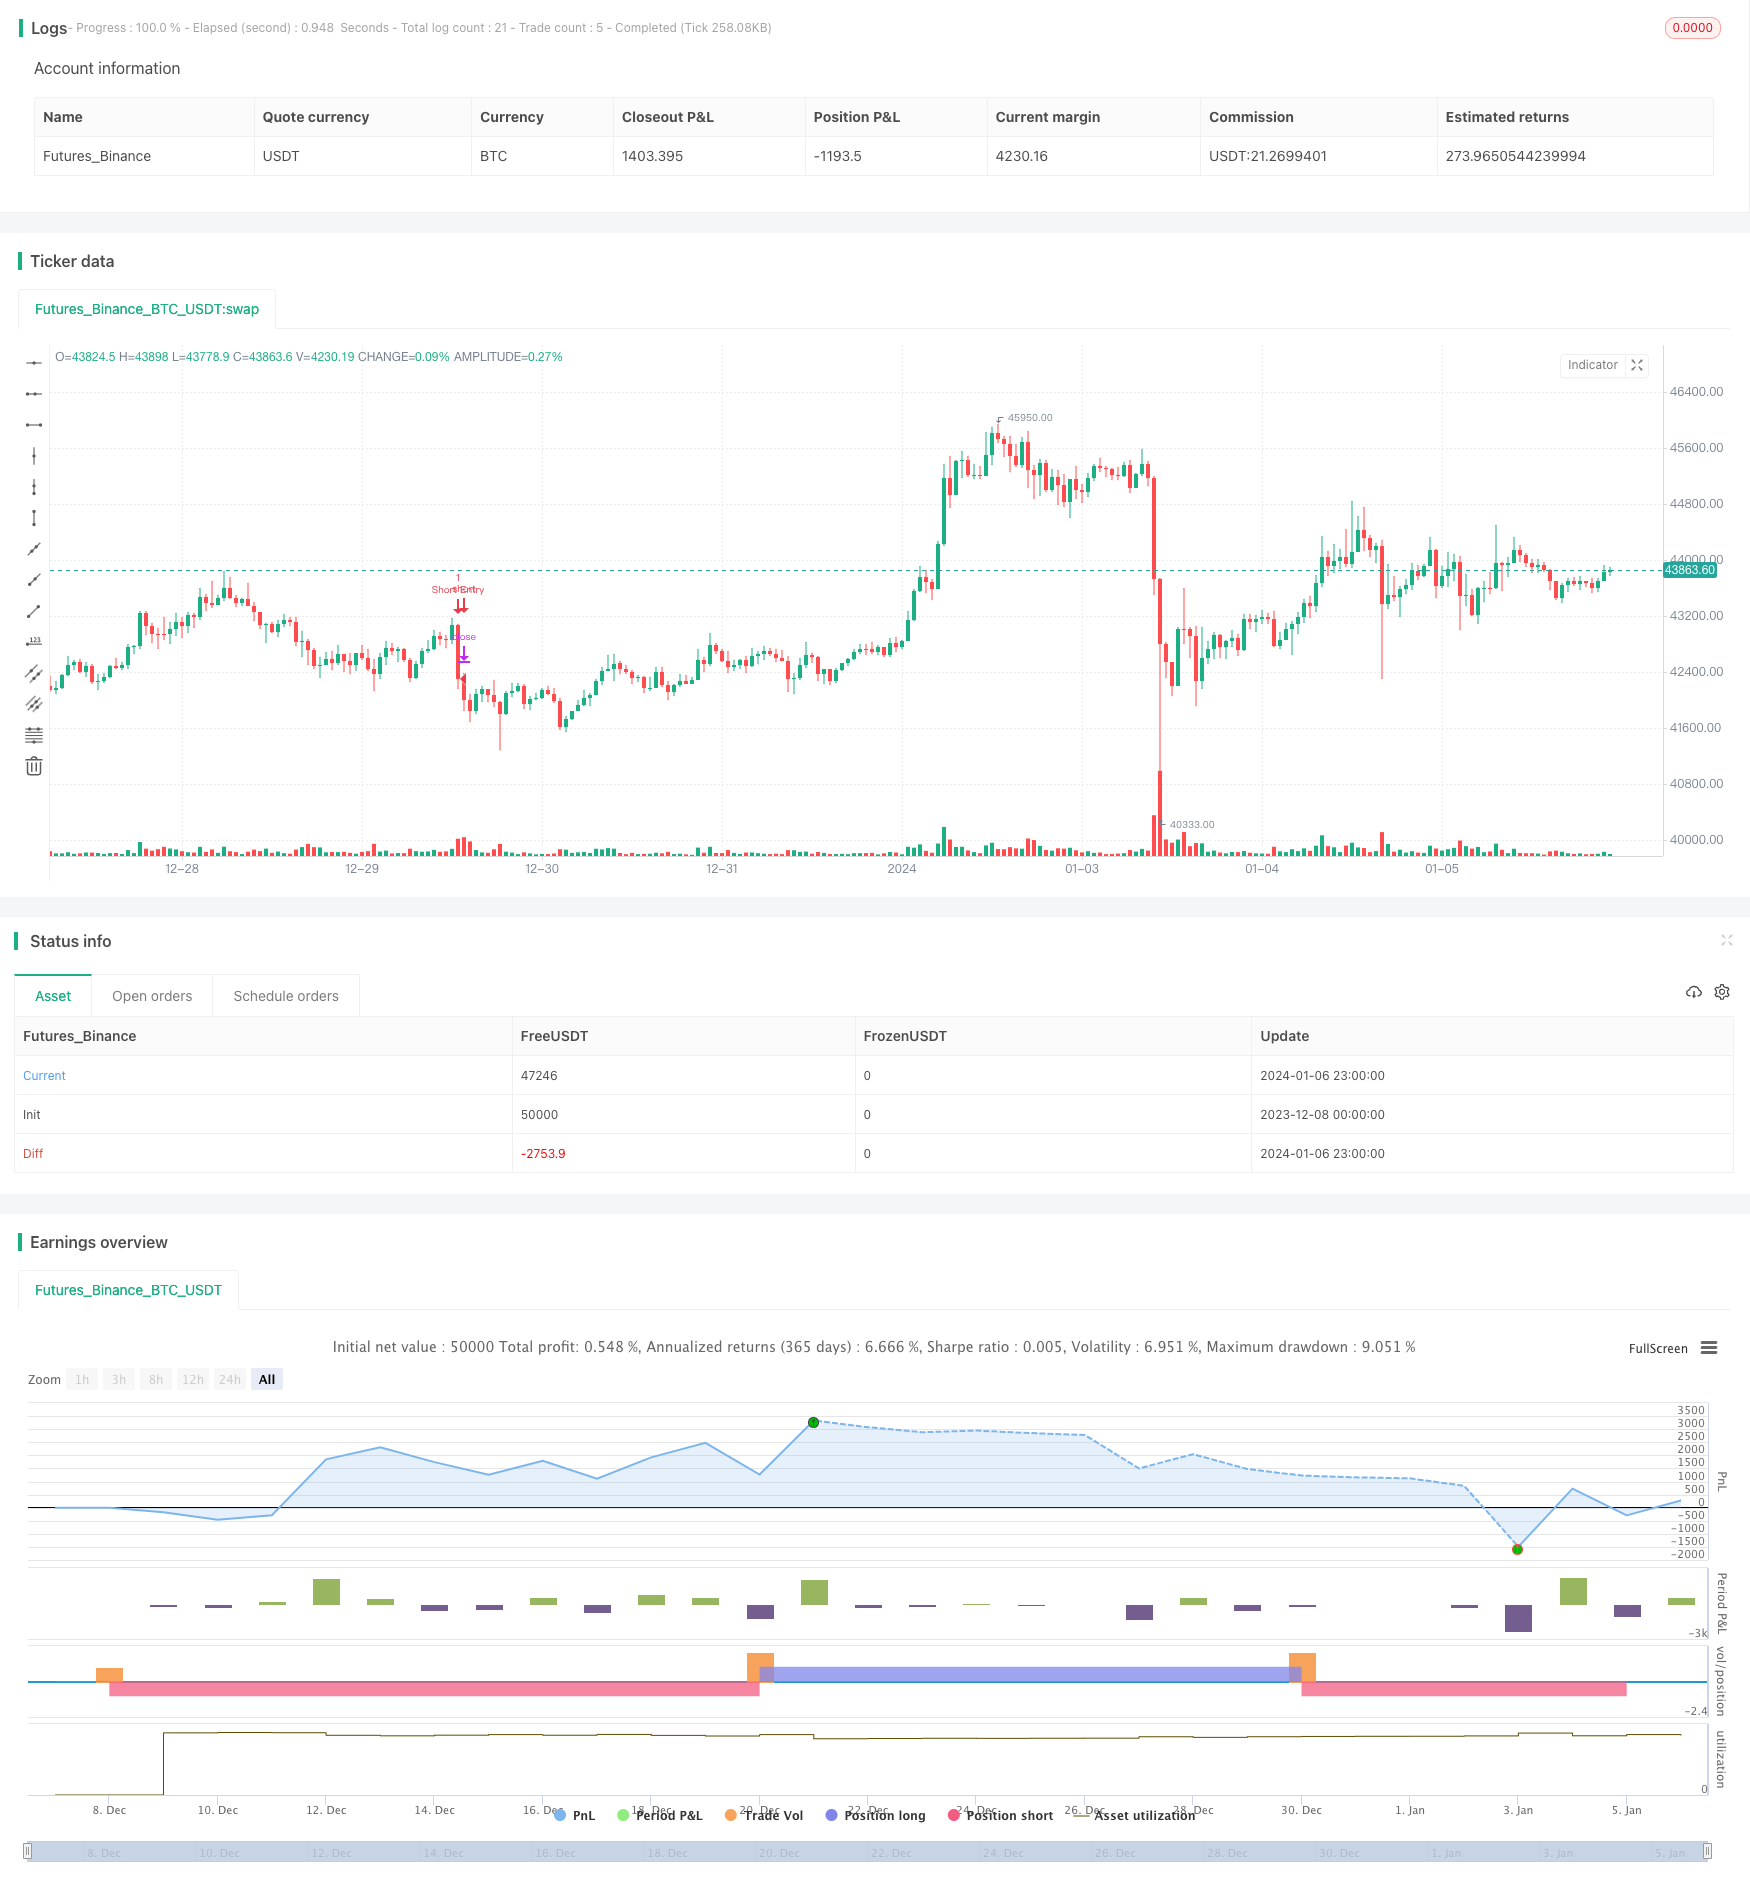
/*backtest
start: 2023-12-08 00:00:00
end: 2024-01-07 00:00:00
period: 1h
basePeriod: 15m
exchanges: [{"eid":"Futures_Binance","currency":"BTC_USDT"}]
*/

//@version=5
strategy("Get Funded Easily by mjanusic", shorttitle="FTMO Crusher by mjanusic", overlay=true)

///////////// RSI
RSIlength = input(16, title="RSI Period Length")
RSIvalue = input(45, title="RSI Value Range")
RSIoverSold = 0 + RSIvalue
RSIoverBought = 100 - RSIvalue
price = close
vrsi = ta.rsi(price, RSIlength)

///////////// Bollinger Bands
BBlength = input(20, title="Bollinger Bands SMA Period Length")
BBmult = input(2.0, title="Bollinger Bands Standard Deviation")
BBbasis = ta.sma(price, BBlength)
BBdev = BBmult * ta.stdev(price, BBlength)
BBupper = BBbasis + BBdev
BBlower = BBbasis - BBdev
source = close
buyCondition = ta.crossover(vrsi, RSIoverSold) and ta.crossover(source, BBlower)
sellCondition = ta.crossunder(vrsi, RSIoverBought) and ta.crossunder(source, BBupper)

///////////// RSI + Bollinger Bands Strategy
if (not na(vrsi))
    if (buyCondition)
        strategy.entry("Long Entry", strategy.long, stop=BBlower, comment="Long Entry")
    else
        strategy.cancel(id="Long Entry")

    if (sellCondition)
        strategy.entry("Short Entry", strategy.short, stop=BBupper, comment="Short Entry")
    else
        strategy.cancel(id="Short Entry")

//plot(strategy.equity, title="equity", color=color.red, linewidth=2, style=plot.style_area)