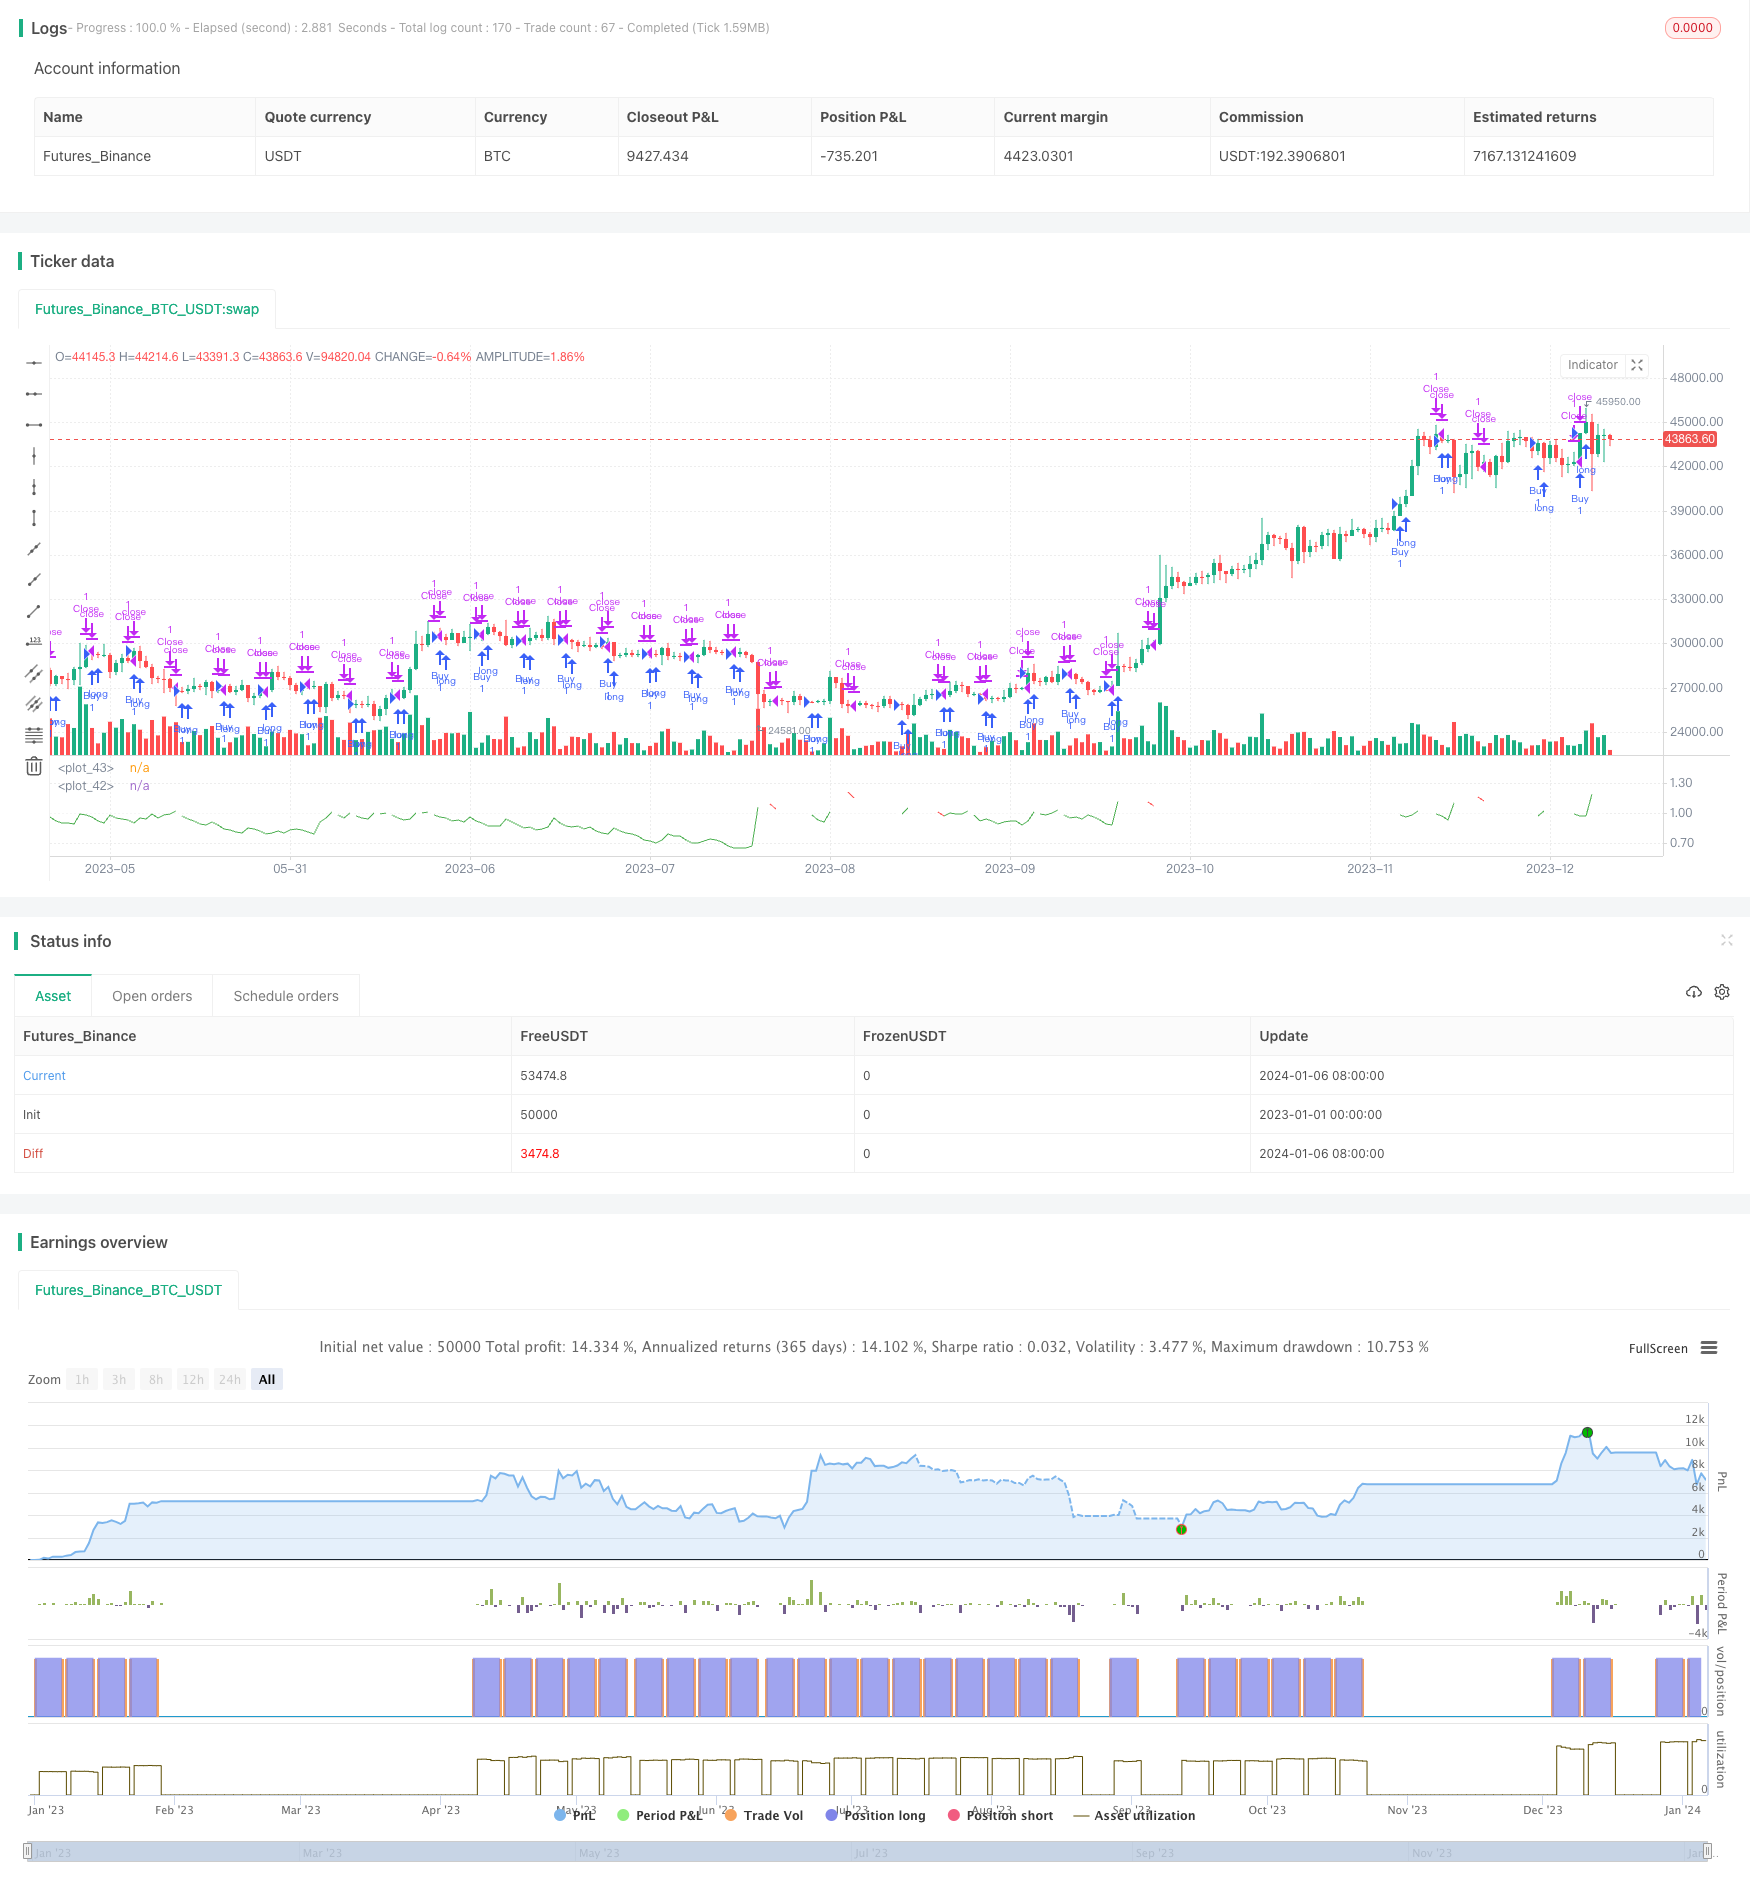
概述
本策略目的是研究购买低波动率和高波动率期间的资产之间的差异。它允许用户通过改变mode输入变量在低波动率和高波动率期间选择买入。
策略原理
本策略通过计算ATR和它的SMA来确定波动率。具体来说,它计算ATR的SMA,然后计算ATR与其SMA的比率。如果此比率高于用户定义的阈值volatilityTargetRatio,则认为波动率高;如果低于该阈值,则认为波动率低。
根据用户选择的mode,策略在波动率高或波动率低时产生买入信号。一旦买入,策略会持有一定的bars数目(由sellAfterNBarsLength定义),然后平仓。
优势分析
该策略的主要优势如下: 1. 可以直观地比较低波动率和高波动率期间的买入策略表现。 2. 使用SMA平滑ATR,可以过滤假突破。 3. 可以通过调整参数测试不同的波动率水平。
风险分析
该策略的主要风险如下: 1. 如果只买入低波动率,可能会错过价格上涨机会。 2. 如果只买入高波动率,可能增加系统风险。 3. 参数设置不当可能导致错过买入时机或平仓过早。
以上风险可以通过调整参数、组合不同波动率水平的买入来缓解。
优化方向
该策略可以进一步优化: 1. 测试不同的ATR长度参数。 2. 增加止损策略。 3. 结合其他指标过滤假突破。 4. 优化买入和平仓条件。
总结
本策略可以有效地比较低波动率和高波动率买入策略的表现。它使用SMA平滑ATR,根据波动率水平产生交易信号。该策略可以通过调整参数和优化条件得到改进。总的来说,本策略为研究波动率策略提供了有效工具。
策略源码
/*backtest
start: 2023-01-01 00:00:00
end: 2024-01-07 00:00:00
period: 1d
basePeriod: 1h
exchanges: [{"eid":"Futures_Binance","currency":"BTC_USDT"}]
*/

// This source code is subject to the terms of the Mozilla Public License 2.0 at https://mozilla.org/MPL/2.0/
// © I11L

//@version=5
strategy("I11L - Better Buy Low Volatility or High Volatility?", overlay=false)

mode = input.string("Buy low Volatility",options = ["Buy low Volatility","Buy high Volatility"])
volatilityTargetRatio = input.float(1,minval = 0, maxval = 100,step=0.1, tooltip="1 equals the average atr for the security, a lower value means that the volatility is lower")
atrLength = input.int(14)

atr = ta.atr(atrLength) / close
avg_atr = ta.sma(atr,atrLength*5)
ratio = atr / avg_atr

sellAfterNBarsLength = input.int(5, step=5, minval=0)


var holdingBarsCounter = 0

if(strategy.opentrades > 0)
    holdingBarsCounter := holdingBarsCounter + 1


isBuy = false

if(mode == "Buy low Volatility")
    isBuy := ratio < volatilityTargetRatio
else
    isBuy := ratio > volatilityTargetRatio

isClose = holdingBarsCounter > sellAfterNBarsLength


if(isBuy)
    strategy.entry("Buy",strategy.long)

if(isClose)
    holdingBarsCounter := 0
    strategy.exit("Close",limit=close)

plot(ratio, color=isBuy[1] ? color.green : isClose[1] ? color.red : color.white)
plot(1, color=color.white)