概述
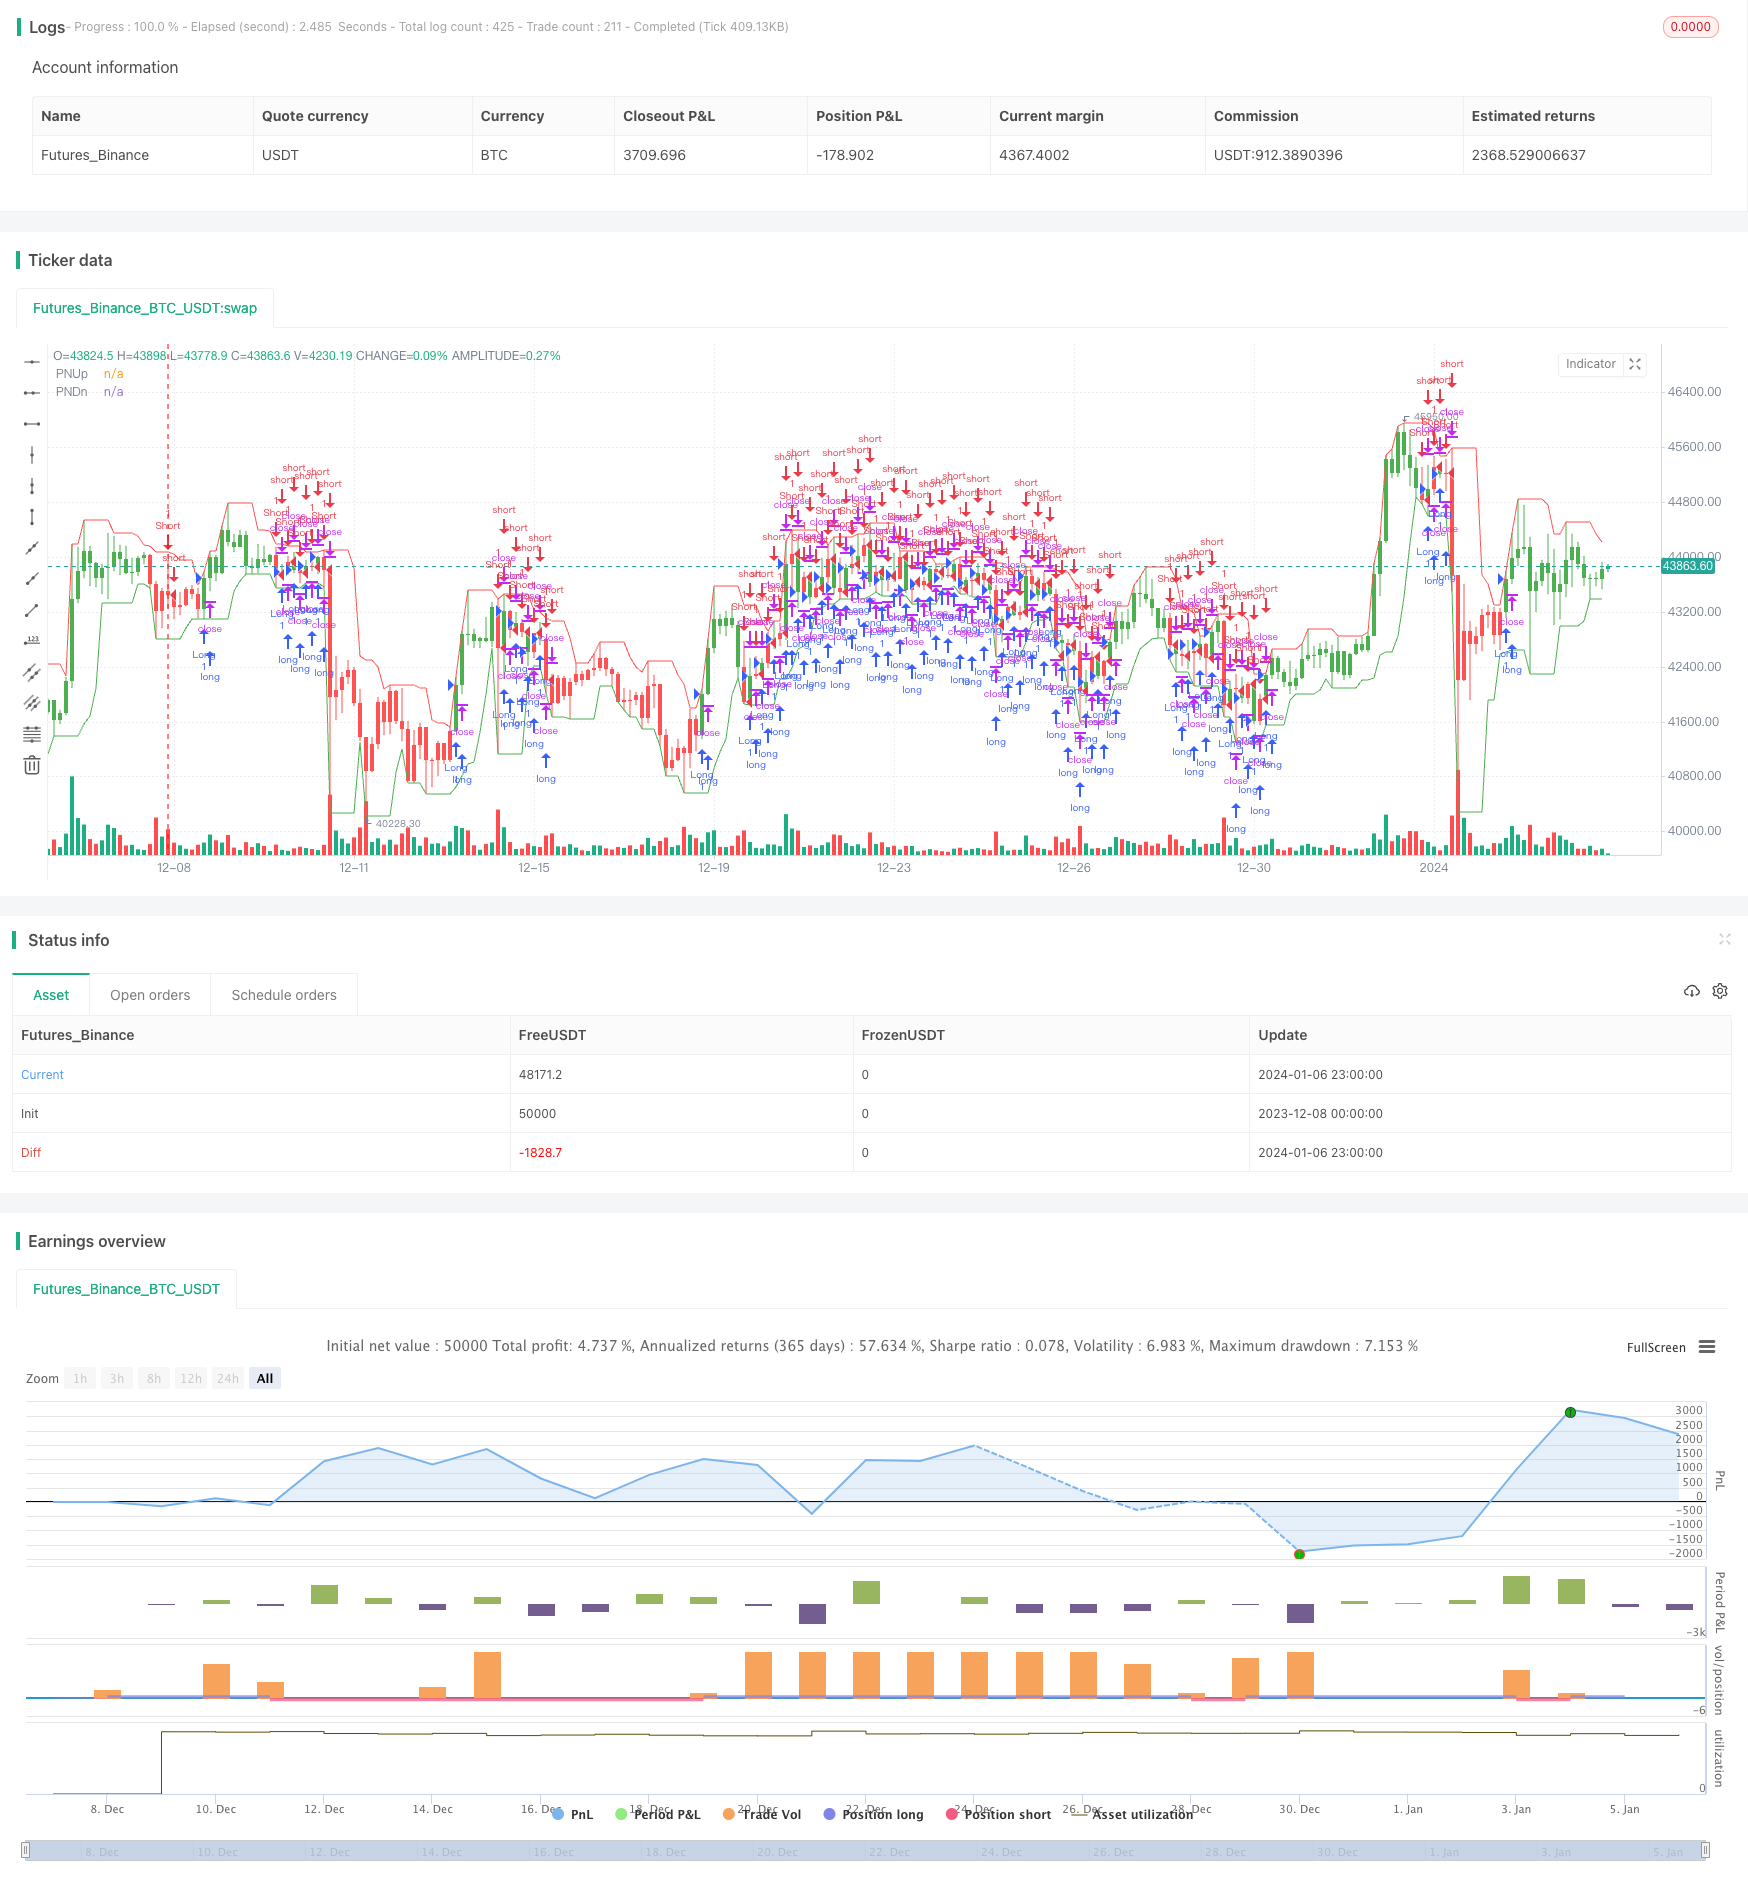
质数波带回测策略通过识别价格附近的最高和最低质数,并将这两个质数系列绘制为一个波带,来判断市场趋势。该策略由模数金融工程公司开发。
策略原理
- 根据输入的容差百分比percent,遍历一个指定价格的正负波动范围,寻找最高和最低的质数。
- 使用highest和lowest函数获取最近N根K线中的质数波带最高点和最低点。
- 判断收盘价是否突破质数波带最高点和最低点,决定做多或者做空方向。
- 可选择反转交易信号。
优势分析
- 利用质数的随机且不规则分布特性,捕捉市场中的随机性。
- 质数波带具有一定的滞后性,可以过滤掉部分噪音。
- 质数波带上下限灵活,可以通过调整容差百分比来适应不同周期和不同交易品种。
风险分析
- 质数波带并不能完全契合价格运动,存在一定程度的滞后。
- 物极必反的价格反转可能导致错误信号。
- 容差百分比设置过大会过滤掉部分有效讯号。
可以通过适当调整参数、结合其他指标等方式来规避风险。
优化方向
- 可以结合移动平均线等指标,设定双重条件触发信号。
- 可以研究其他随机数的使用,如斐波那契数等。
- 可以引入机器学习算法,实现参数的自动优化。
总结
质数波带回测策略overall是一个非常创新和具有实用价值的策略。它利用质数的特性捕捉市场随机性,同时也考虑到价格滞后识别趋势,研究价值很高。下一步可以从提高信号质量、扩展随机数类型、自动优化等方面进行优化,使策略效果更加出色。
策略源码
/*backtest
start: 2023-12-08 00:00:00
end: 2024-01-07 00:00:00
period: 3h
basePeriod: 15m
exchanges: [{"eid":"Futures_Binance","currency":"BTC_USDT"}]
*/

//@version=2
////////////////////////////////////////////////////////////
//  Copyright by HPotter v1.0 27/03/2018
// Determining market trends has become a science even though a high number
// or people still believe it’s a gambling game. Mathematicians, technicians,
// brokers and investors have worked together in developing quite several
// indicators to help them better understand and forecast market movements.
// The Prime Number Bands indicator was developed by Modulus Financial Engineering
// Inc. This indicator is charted by indentifying the highest and lowest prime number
// in the neighborhood and plotting the two series as a band.
//
// You can change long to short in the Input Settings
// WARNING:
//  - For purpose educate only
//  - This script to change bars colors.
////////////////////////////////////////////////////////////
PrimeNumberUpBand(price, percent) =>
    res = 0
    res1 = 0
    for j = price to price + (price * percent / 100)
        res1 := j
	    for i = 2 to sqrt(price)
        	res1 := iff(j % i == 0 , 0, j)
            if res1 == 0
                break
		if res1 > 0
		    break
    res := iff(res1 == 0, res[1], res1)
    res

PrimeNumberDnBand(price, percent) =>
    res = 0
    res2 = 0
    for j = price to price - (price * percent / 100)
        res2 := j
	    for i = 2 to sqrt(price)
        	res2 := iff(j % i == 0 , 0, j)
            if res2 == 0
                break
		if res2 > 0
		    break
    res := iff(res2 == 0, res[1], res2)
    res

strategy(title="Prime Number Bands Backtest", overlay = true)
percent = input(5, minval=0.01, step = 0.01, title="Tolerance Percentage")
Length = input(5, minval=1)
srcUp = input(title="Source Up Band",  defval=high)
srcDn = input(title="Source Down Band",  defval=low)
reverse = input(false, title="Trade reverse")
xPNUB = PrimeNumberUpBand(srcUp, percent)
xPNDB = PrimeNumberDnBand(srcDn, percent)
xHighestPNUB = highest(xPNUB, Length)
xLowestPNUB = lowest(xPNDB, Length)
pos = iff(close > xHighestPNUB[1], 1,
       iff(close < xLowestPNUB[1], -1, nz(pos[1], 0)))
possig = iff(reverse and pos == 1, -1,
          iff(reverse and pos == -1, 1, pos))
if (possig == 1)
    strategy.entry("Long", strategy.long)
if (possig == -1)
    strategy.entry("Short", strategy.short)
barcolor(possig == -1 ? red: possig == 1 ? green : blue )
plot(xHighestPNUB, color=red, title="PNUp")
plot(xLowestPNUB, color=green, title="PNDn")