概述
这是一个利用多重技术指标进行交易信号判断的策略。它整合了海龟交易法则的双重均线交叉系统、加权移动平均线、MACD和TSI四种主流技术指标,形成多重确认的交易策略。这种组合可以有效过滤假信号,提高稳定性。
原理
该策略的核心原理是多重技术指标的交叉组合。包括以下几个方面:
利用海龟交易法则的双重均线交叉产生交易信号。分别计算7日和14日的双重Hull移动平均线,当短期均线上穿长期均线时看涨,下穿时看跌。
计算1日的加权移动平均线,作为重要的长期趋势判断指标。
计算MACD指标并判断其与信号线的金叉死叉。MACD大于信号线时看涨,小于时看跌。
计算TSI指标并判断其是否高于超买线或低于超卖线。TSI高于超买线时看跌,低于超卖线时看涨。
在入场时,要同时满足以下多个条件: - 7日线上穿14日线 - 1日加权移动平均线若在下方,则仅做多;若在上方,则仅做空 - MACD上穿信号线 - TSI较超卖线高(做多)或较超买线低(做空)
这样可以有效避免单一技术指标产生的假信号,提高稳定性。
优势
这种多重指标交叉组合策略有以下几个优势:
多重确认,有效过滤假信号,避免失误交易。
技术指标覆盖短中长期,可以捕捉不同级别的交易机会。
海龟交易法则经得起实战检验,容易实现稳定盈利。
MACD指标对短期行情变化敏感,可以提高策略的实时性。
TSI指标比较平滑,可以有效识别超买超卖情况。
移动平均线作为重要的长期趋势指标,防止逆势交易。
综上,这种策略集多个指标优点于一体,既稳定又灵活,盈利空间大,是非常出色的量化策略。
风险
这种策略也存在一定的风险,主要集中在以下几个方面:
多重指标增加了策略复杂度,参数设置和优化难度较大。
指标之间可能出现分歧,从而影响策略稳定性。
技术指标发出假信号的概率无法完全消除。
错过短期行情反转的机会,无法捕捉快速反转带来的套利空间。
对应地,可以从以下几个方面进一步优化:
寻找指标参数的最优组合,提高指标间的协同性。
增加止损机制,控制单次损失。
结合更多不同类型、不同周期的指标,进一步提高稳定性。
适当保留部分资金,利用反转技巧进行套利。
优化方向
这种策略可以从以下几个方面进行进一步优化:
- 参数优化。可以对指标的参数如周期长度、线数、超买超卖区间等进行优化,找到最佳参数组合。
2.增加止损机制。适当设置移动止损或CLASSES等止损方式,控制亏损。
增加更多指标。可以添加KD,OBV,波动率等其他指标,形成更多维度的交叉验证。
结合机器学习。将多种技术指标作为输入,运用神经网络等进行信号判断和参数优化。
适当保留资金进行对冲。持有一定的反向头寸,利用反转获利。
总结
本策略通过海龟交易法则、移动平均线、MACD和TSI四种技术指标的组合运用,构建了一个稳定性高、灵活性强、实战效果好的量化策略。它兼顾了短中长期行情的捕捉,多重指标交叉验证有效减少了假信号的概率。通过进一步的参数优化、止损机制的增加以及模型的优化,可以获得更好的策略效果。本策略值得实盘验证与应用。
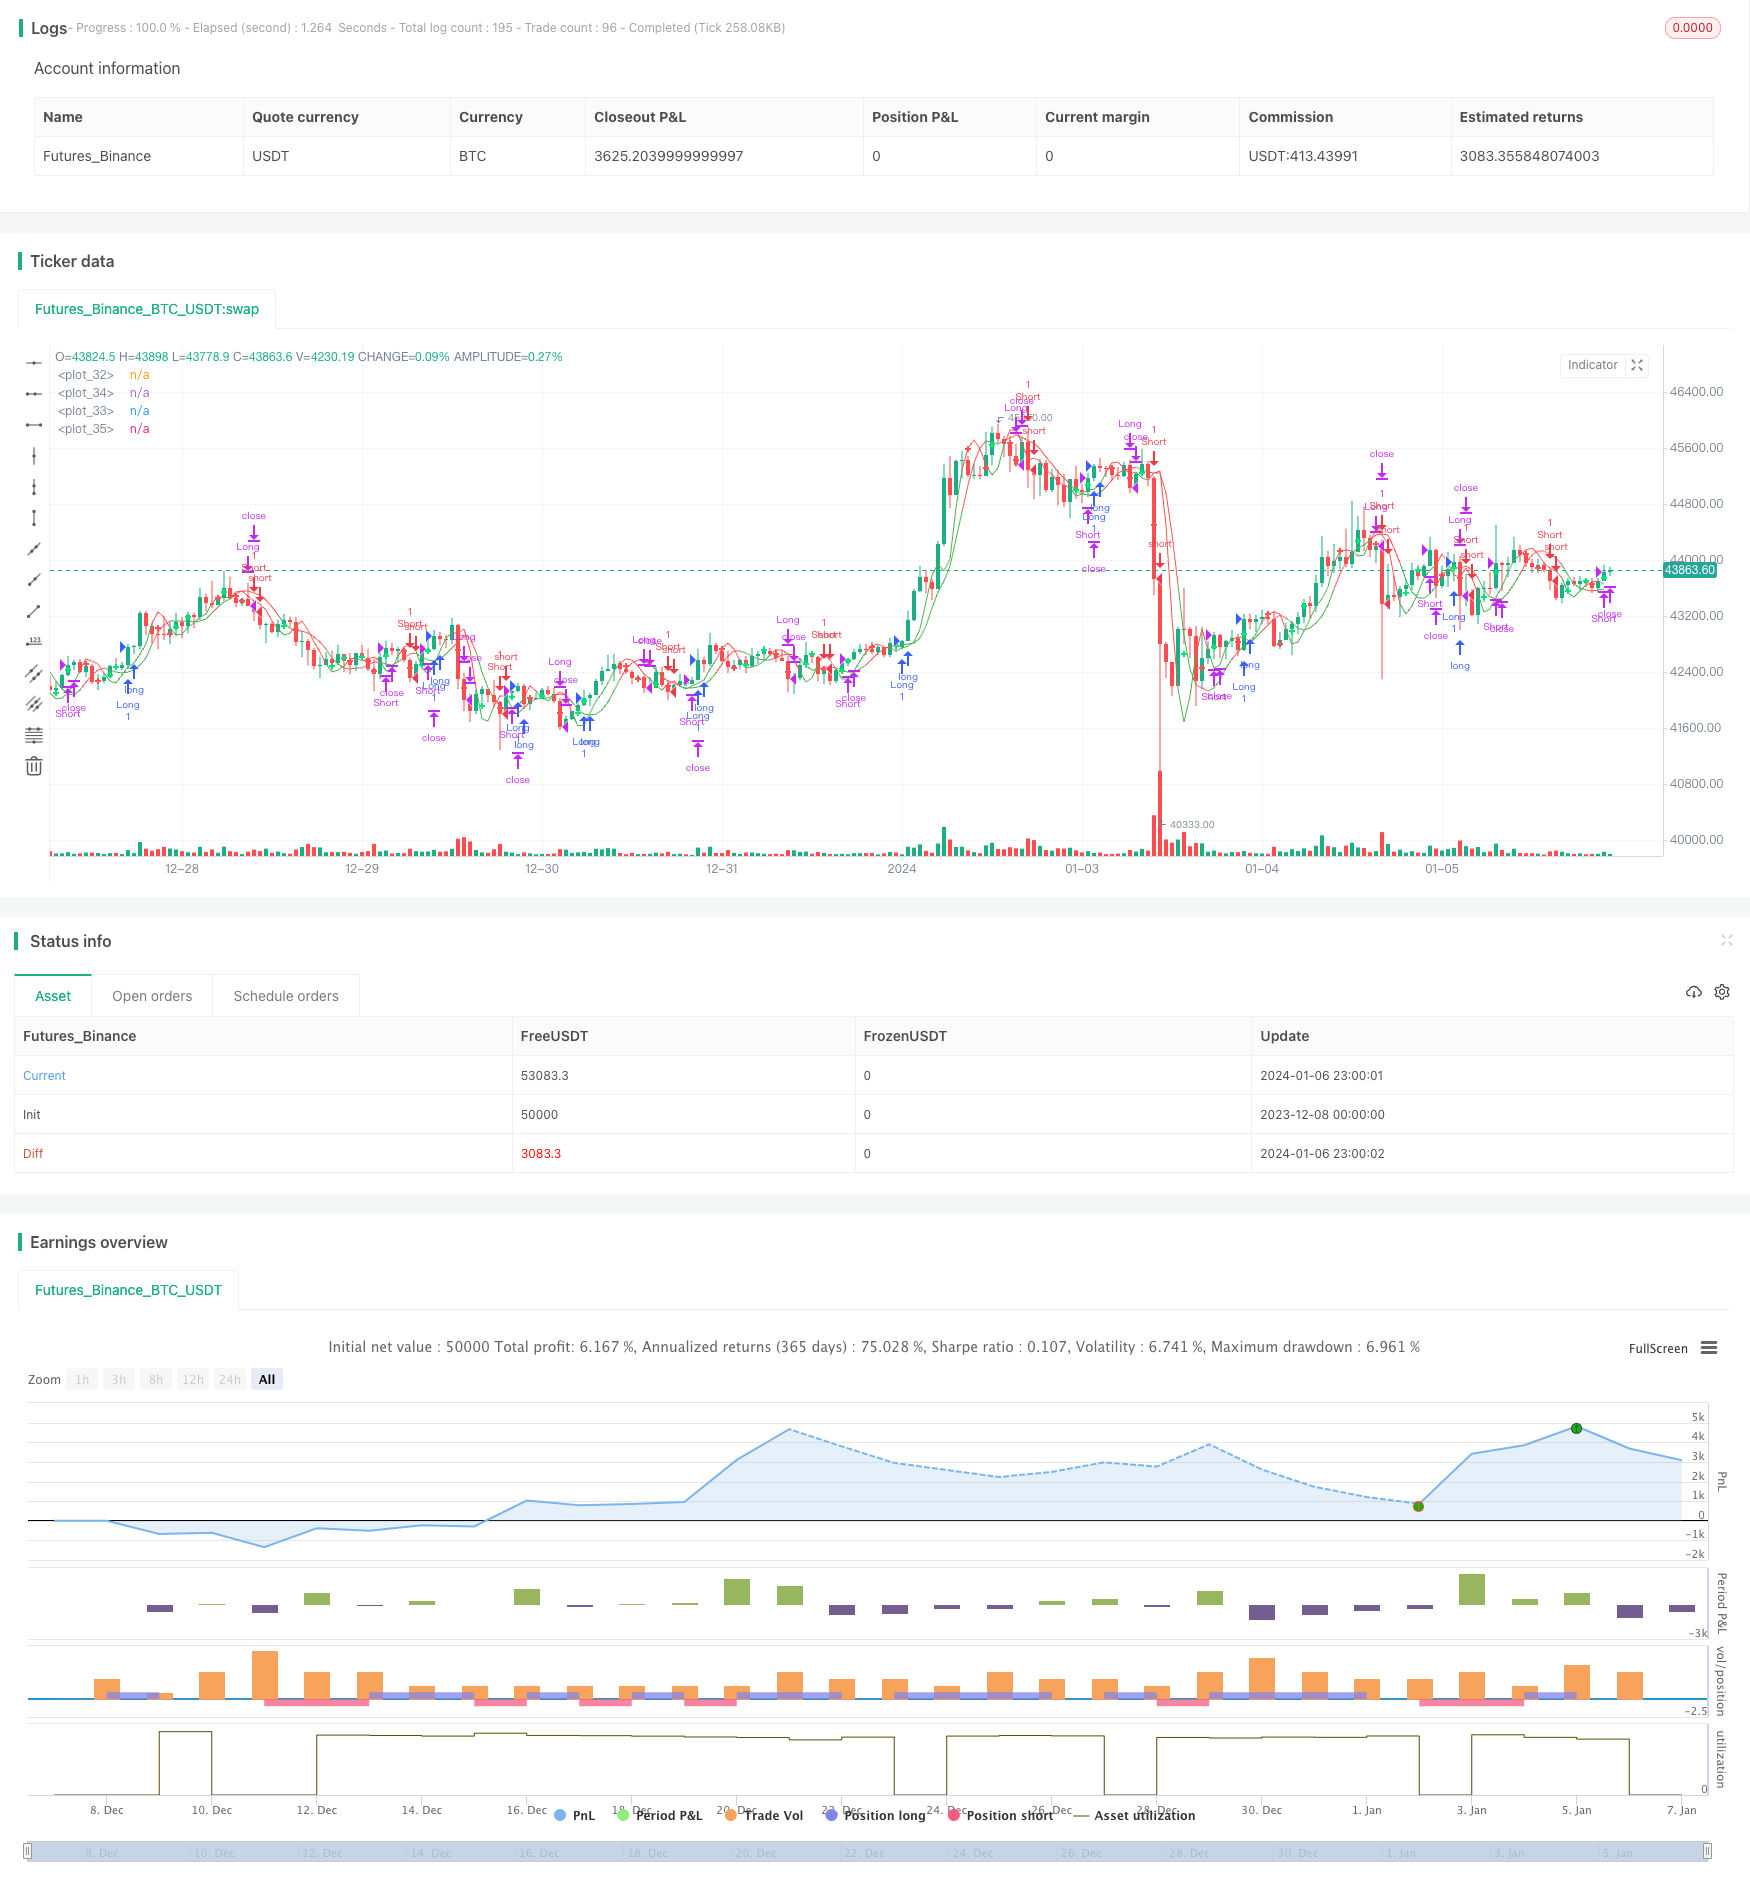
/*backtest
start: 2023-12-08 00:00:00
end: 2024-01-07 00:00:00
period: 1h
basePeriod: 15m
exchanges: [{"eid":"Futures_Binance","currency":"BTC_USDT"}]
*/

//@version=2
//                                                    Quad-HullMA-cross & VWMA & MacD & TSI combination  <<<<< by SeaSide420 >>>>>>
strategy("MultiCross", overlay=true)
keh=input(title="Double HullMA 1",defval=7, minval=1)
teh=input(title="Double HullMA 2",defval=14, minval=1)
meh=input(title="VWMA",defval=1, minval=1)
meh1=vwma(close,round(meh))
n2ma=2*wma(close,round(keh/2))
nma=wma(close,keh)
diff=n2ma-nma,sqn=round(sqrt(keh))
n2ma1=2*wma(close[2],round(keh/2))
nma1=wma(close[2],keh)
diff1=n2ma1-nma1,sqn1=round(sqrt(keh))
n1=wma(diff,sqn)
n2=wma(diff1,sqn)
b=n1>n2?lime:red
c=n1>n2?green:red
n2ma3=2*wma(close,round(teh/2))
nma2=wma(close,teh)
diff2=n2ma3-nma2,sqn2=round(sqrt(teh))
n2ma4=2*wma(close[2],round(teh/2))
nma3=wma(close[2],teh)
diff3=n2ma4-nma3,sqn3=round(sqrt(teh))
n3=wma(diff2,sqn2)
n4=wma(diff3,sqn3)
fastLength = input(title="MacD fastLength", defval=7)
slowlength = input(title="MacD slowlength", defval=14)
MACDLength = input(title="MacD Length", defval=3)
MACD = ema(close, fastLength) - ema(close, slowlength)
aMACD = ema(MACD, MACDLength)
delta = MACD - aMACD
a1=plot(n1,color=c),a2=plot(n2,color=c)
plot(cross(n1, n2) ? n1 : na, style = cross, color=b, linewidth = 3)
a3=plot(n3,color=c),a4=plot(n4,color=c)
plot(cross(n3, n4) ? n1 : na, style = cross, color=b, linewidth = 3)
//a5=plot(meh1,color=c)
long = input(title="TSI Long Length",  defval=5)
short = input(title="TSI Short Length",  defval=3)
signal = input(title="TSI Signal Length",  defval=2)
linebuy = input(title="TSI Upper Line",  defval=4)
linesell = input(title="TSI Lower Line",  defval=-4)
price = close
double_smooth(src, long, short) =>
    fist_smooth = ema(src, long)
    ema(fist_smooth, short)
pc = change(price)
double_smoothed_pc = double_smooth(pc, long, short)
double_smoothed_abs_pc = double_smooth(abs(pc), long, short)
tsi_value = 100 * (double_smoothed_pc / double_smoothed_abs_pc)
closelong = n1<n2 and n3<n4 and n1>meh1
if (closelong)
    strategy.close("Long")
closeshort = n1>n2 and n3>n4 and n1<meh1
if (closeshort)
    strategy.close("Short")
longCondition = strategy.opentrades<1 and n1>n2 and MACD>aMACD and n1<meh1 and n3>n4 and ema(tsi_value, signal)>linesell
if (longCondition)
    strategy.entry("Long",strategy.long)
shortCondition = strategy.opentrades<1  and n1<n2 and MACD<aMACD and n1>meh1 and n3<n4 and ema(tsi_value, signal)<linebuy
if (shortCondition)
    strategy.entry("Short",strategy.short)