概述
该策略基于超级趋势指标,结合ATR来动态设定止损线,从而在以太坊的强势趋势中获利。它可以在Coinbase交易所的ETH/USD交易对上运行。
策略原理
该策略使用了一个经典的趋势跟踪指标——超级趋势指标来判断趋势方向。超级趋势指标由两个曲线组成,分别是:
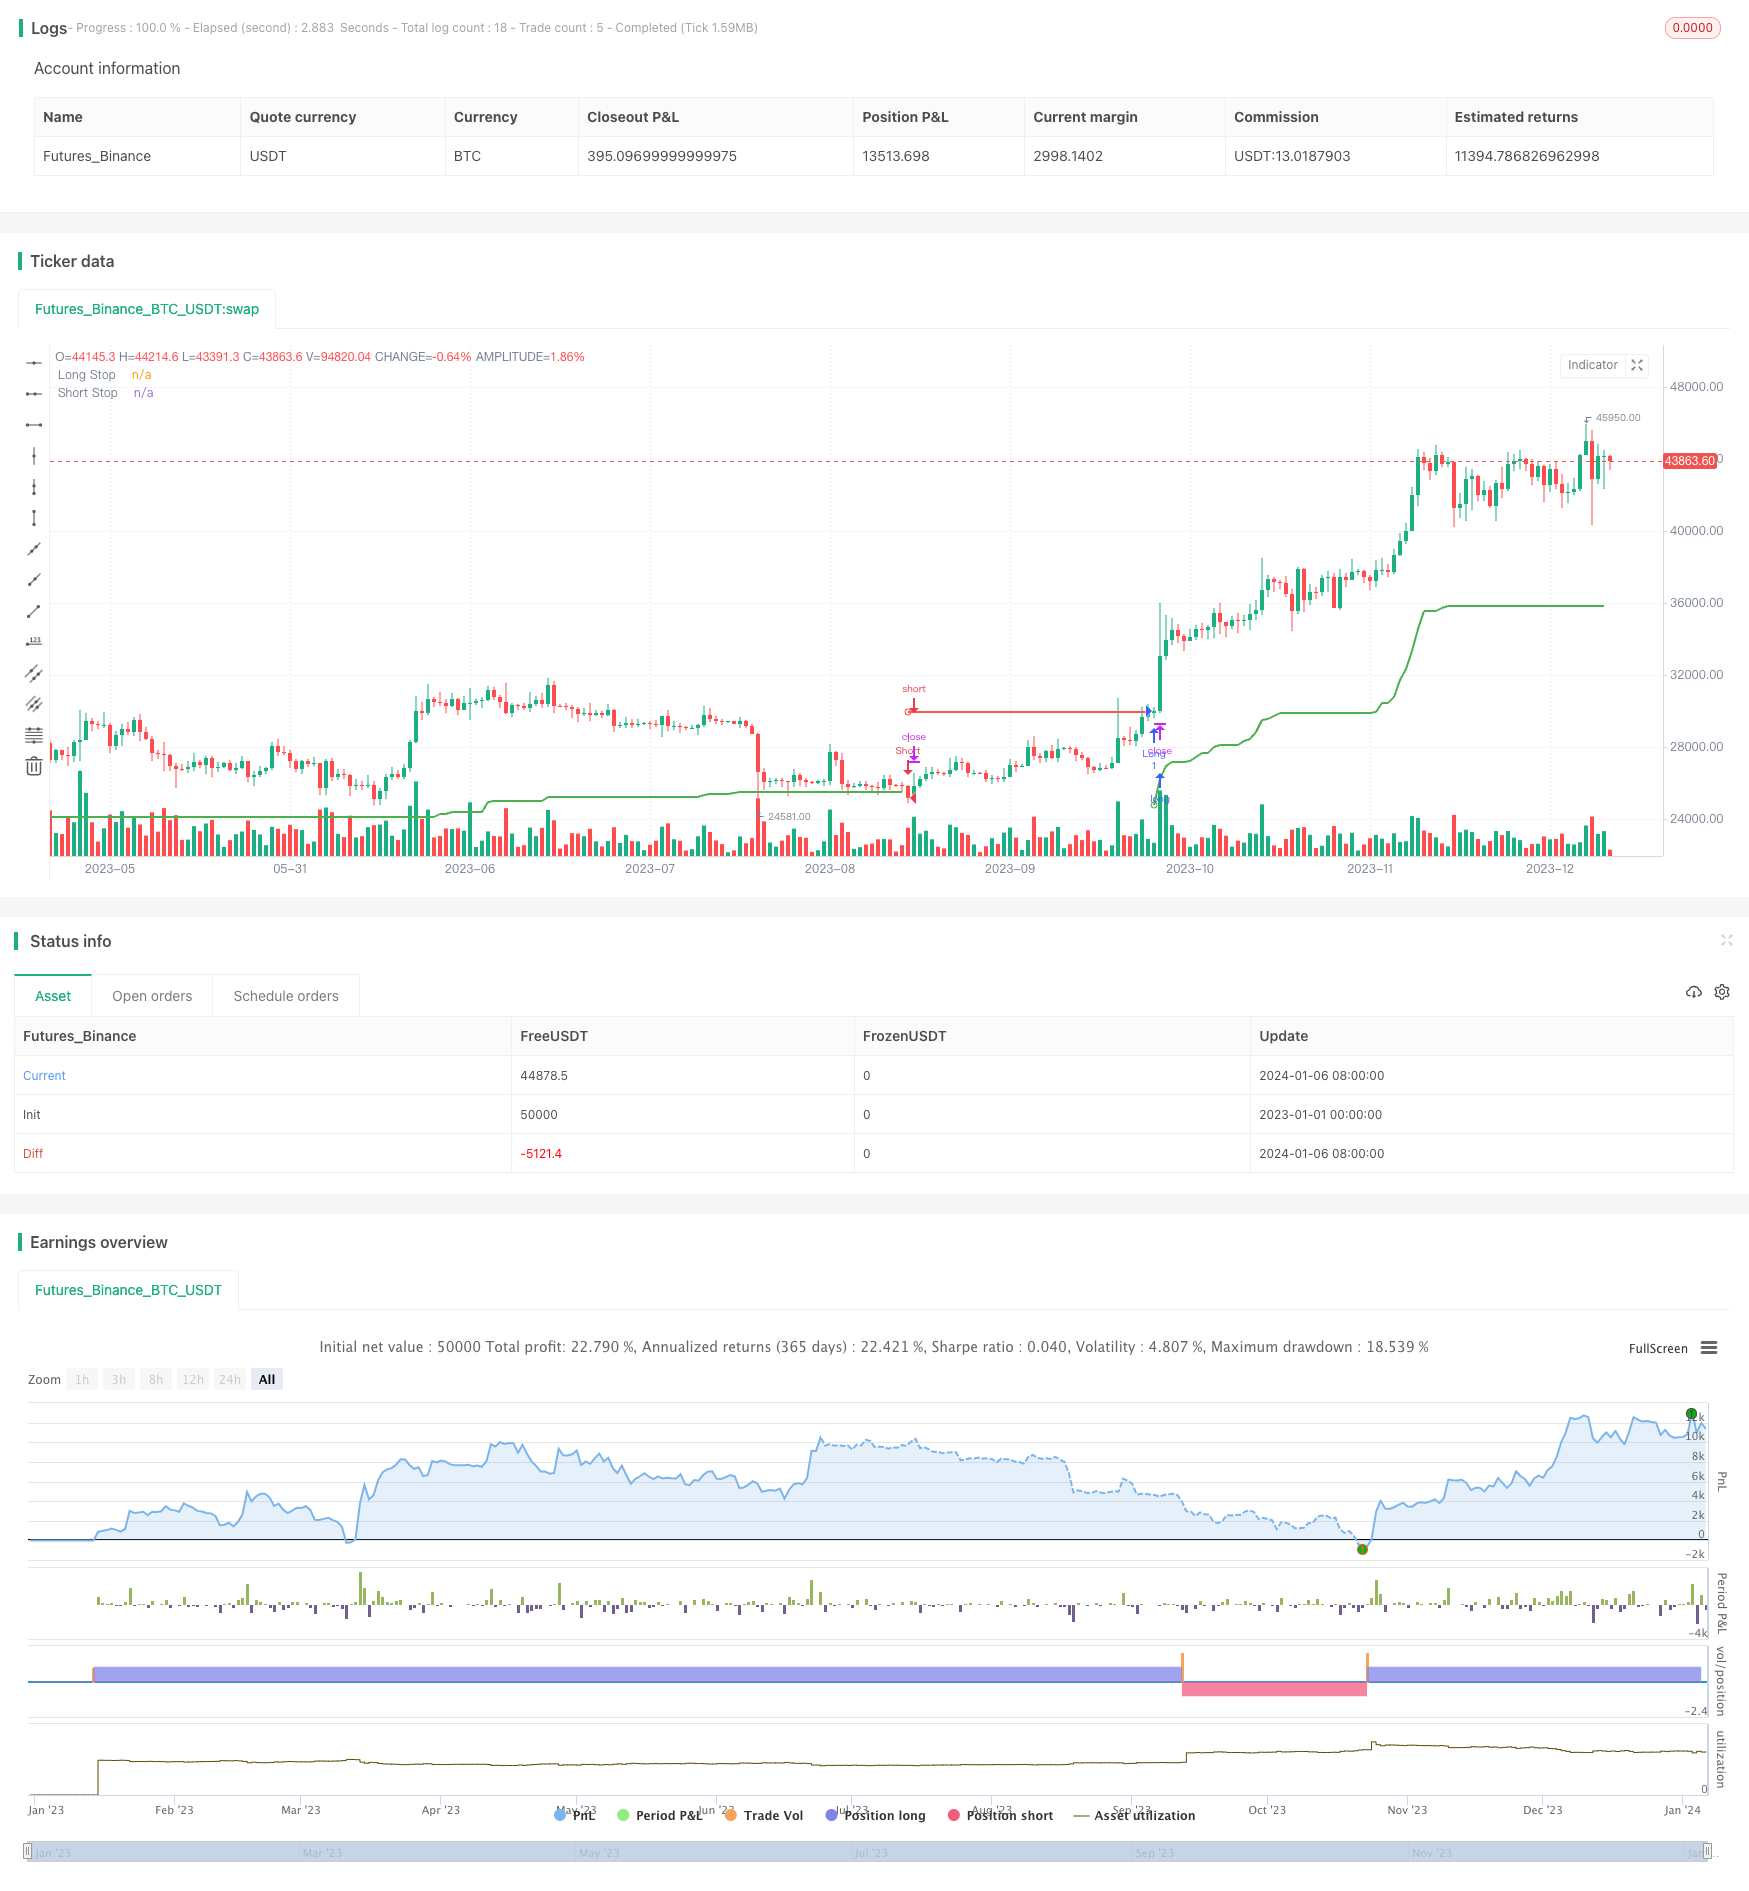
- 上升趋势止损线,在涨势中持有多单;
- 下跌趋势止损线,在跌势中持有空单。
当价格从上升趋势转为下降趋势时,进行空头开仓;当价格从下降趋势转为上升趋势时,进行多头开仓。
此外,策略还利用ATR指标来动态调整止损线的位置。具体来说,上升止损线的位置为最高价与最低价的均值减去ATR乘以一个系数;下跌止损线的位置为最高价与最低价的均值加上ATR乘以一个系数。这样可以根据市场波动程度来调整止损线。
进入信号发出后,如果价格重新回破止损线,则进行止损退出。
策略优势
这是一个较为成熟的趋势跟踪策略,具有如下优势:
- 使用超级趋势指标判断趋势方向,可靠性较高;
- 应用ATR自适应调整止损线,可以有效控制风险;
- 策略逻辑简单清晰,容易理解与修改;
- 可在高波动的数字货币市场中获利。
策略风险
该策略也存在一些风险:
- 超级趋势指标判断错误的概率存在,可能引发不必要的亏损;
- ATR止损可能过于激进,被价格反转止出;
- 数字货币市场波动大,止损被突破的概率较大;
- 交易手续费较高的交易所,会影响最终盈利。
为降低上述风险,可以适当调整ATR系数,或结合其他指标过滤交易信号。 止损位置也可以考虑留有一定缓冲。
策略优化方向
该策略还有进一步优化的空间:
- 可以引入更多指标组合,提高信号的准确性;
- 可以研究ATR系数和长度参数的最优值;
- 可以设定风险止损比来动态调整头寸规模;
- 可以在更多数字货币交易对上测试策略的有效性。
总结
本策略整体来说是一个成熟可靠的趋势跟踪策略。它使用超级趋势指标判断趋势方向,并利用ATR来调整止损位置,以控制风险的同时获利。该策略适用于高波动的数字货币交易,在以太坊等主流币种上效果较好。通过进一步优化,可以使策略在更广泛的市场中应用,获得更稳定的超额收益。
策略源码
/*backtest
start: 2023-01-01 00:00:00
end: 2024-01-07 00:00:00
period: 1d
basePeriod: 1h
exchanges: [{"eid":"Futures_Binance","currency":"BTC_USDT"}]
*/

//@version=4
strategy("SuperTrend Strategy",
     overlay=true,
     initial_capital=2e3,
     process_orders_on_close=true,
     commission_type=strategy.commission.percent,
     commission_value=0.1
     )

length = input(title="ATR Period", type=input.integer, defval=21)
mult = input(title="ATR Multiplier", type=input.float, step=.25, defval=6.2)
wicks = input(title="Take Wicks into Account ?", type=input.bool, defval=false)

useDate = input(title="Start from Specific Date ?", defval=false)
yearStart = input(title="Start Year", defval=2019)
monthStart = input(title="Start Month", minval=1, maxval=12, defval=1)
dayStart = input(title="Start Day", minval=1, maxval=31, defval=1)

startTime = timestamp(yearStart, monthStart, dayStart, 0, 0)
startFrom = useDate ? time(timeframe.period) >= startTime : true

atr = mult * ta.atr(length)

longStop = hl2 - atr
longStopPrev = nz(longStop[1], longStop)
longStop := (wicks ? low[1] : close[1]) > longStopPrev ? math.max(longStop, longStopPrev) : longStop

shortStop = hl2 + atr
shortStopPrev = nz(shortStop[1], shortStop)
shortStop := (wicks ? high[1] : close[1]) < shortStopPrev ? math.min(shortStop, shortStopPrev) : shortStop

dir = 1
dir := nz(dir[1], dir)
dir := dir == -1 and (wicks ? high : close) > shortStopPrev ? 1 : dir == 1 and (wicks ? low : close) < longStopPrev ? -1 : dir

longColor = color.green
shortColor = color.red

plot(dir == 1 ? longStop : na, title="Long Stop", style=plot.style_linebr, linewidth=2, color=longColor)
plotshape(dir == 1 and dir[1] == -1 ? longStop : na, title="Long Start", location=location.absolute, style=shape.circle, size=size.tiny, color=longColor, transp=0)

plot(dir == 1 ? na : shortStop, title="Short Stop", style=plot.style_linebr, linewidth=2, color=shortColor)
plotshape(dir == -1 and dir[1] == 1 ? shortStop : na, title="Short Start", location=location.absolute, style=shape.circle, size=size.tiny, color=shortColor, transp=0)

longCondition = dir[1] == -1 and dir == 1
if longCondition and startFrom
    strategy.entry("Long", strategy.long, stop=longStop)
else
    strategy.cancel("Long")

shortCondition = dir[1] == 1 and dir == -1
if shortCondition and startFrom
    strategy.entry("Short", strategy.short, stop=shortStop)
else
    strategy.cancel("Short")