概述
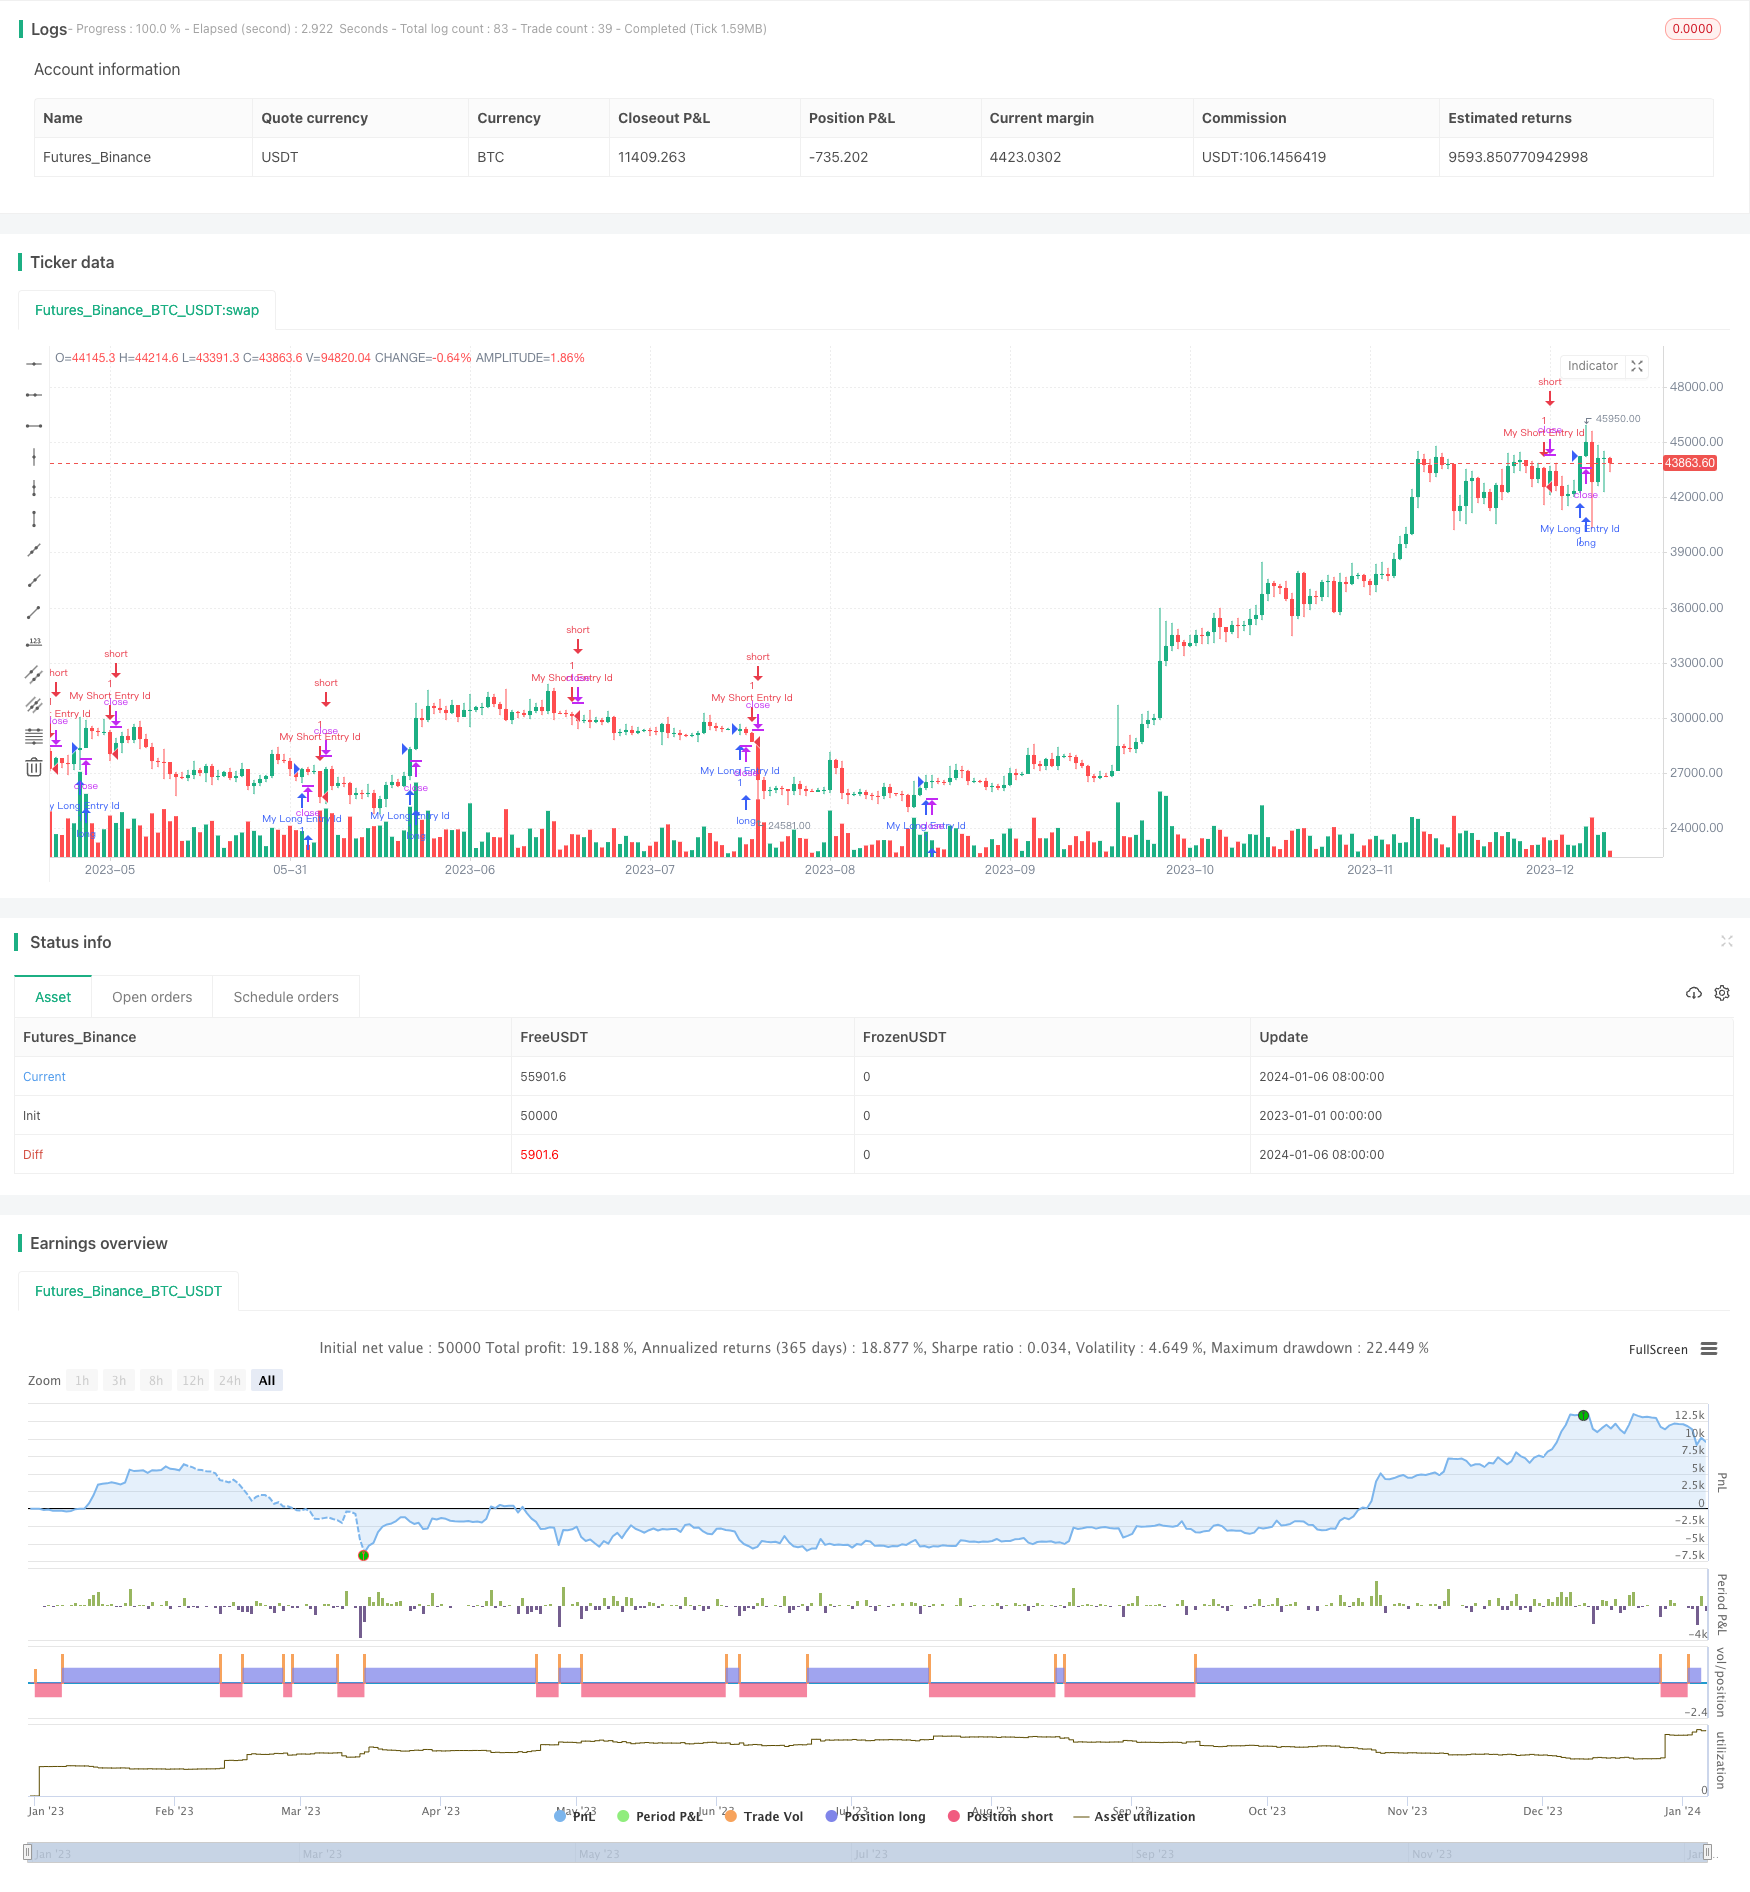
这个策略的主要功能是实时跟踪和展示每月的收益表现。它会在一个表格里面实时更新每月的具体盈亏情况。
原理
该策略通过以下几个步骤实现月度收益表现跟踪:
- 定义变量记录本月是否有交易平仓的情况。
- 定义变量记录每月的具体盈亏数值。
- 定义变量记录时间对应的月份。
- 当本月有平仓时,记录本月盈亏和月份到对应的数组里。
- 在表格指定位置显示月份标题。
- 遍历月份盈亏数组,在表格对应的月份列显示盈亏值。
- 同时显示对应的年份信息。
- 对每年的盈亏进行汇总。
- 使用颜色区分盈亏的正负。
以上就是该策略的基本步骤和工作原理。
优势分析
这种月度盈亏表现跟踪策略具有以下几个优势:
- 实时更新,可以随时查看最新的月度盈亏情况。
- 一目了然,使用表格直观展示每月具体盈亏。
- 细粒度,可以清晰看到每个月份的详情。
- 直观比较,使用颜色可以更直观地对比每个月的盈亏。
- 汇总统计,同时给出每年的盈亏汇总情况。
- 可定制展示,可以调整表格位置、大小等展示方式。
风险分析
该策略也存在一些风险:
- 计算逻辑较复杂,容易出错导致数据不准确。
- 表格展示过于频繁刷新,可能影响性能。
- 数组数据存储效率较低。
- 时间和月份的转换计算可能出错。
可以通过以下方法降低风险:
- 严格代码审查,确保计算逻辑正确。
- 优化表格刷新频率,防止过度刷新。
- 改用更高效的数据结构存储数据。
- 添加时间和月份转换的异常处理。
策略优化
该策略可以从以下几个方面进行优化:
- 使用更高效的数据结构,如字典存储每月数据。
- 增加年化收益率的计算。
- 增加涨跌幅和其他衡量指标。
- 可视化地显示收益曲线走势。
- 支持自定义开始结束统计时间段。
- 支持导出数据到CSV文件。
这些优化可以让策略的功能更加完善和强大,使用体验也会更好。
总结
该策略利用数组和表格的方式,实现了实时跟踪和展示每个月收益情况的核心功能。简单高效,使用也很方便。同时也具有一定的优势,但也存在一些风险需要防范。通过一些计算逻辑和性能的优化,可以使该策略变得更加完美和强大。总的来说,这是一个非常实用的月度收益表现跟踪策略。
策略源码
/*backtest
start: 2023-01-01 00:00:00
end: 2024-01-07 00:00:00
period: 1d
basePeriod: 1h
exchanges: [{"eid":"Futures_Binance","currency":"BTC_USDT"}]
*/

// This source code is subject to the terms of the Mozilla Public License 2.0 at https://mozilla.org/MPL/2.0/
// © MAURYA_ALGO_TRADER

//@version=5
strategy("Monthly Performance", overlay=true)

period = input(20, "Length")

longCondition =   close > high[20]  //ta.crossover(ta.sma(close, 14), ta.sma(close, 28))
if (longCondition)
    strategy.entry("My Long Entry Id", strategy.long)

shortCondition = close < low[20]  //ta.crossunder(ta.sma(close, 14), ta.sma(close, 28))
if (shortCondition)
    strategy.entry("My Short Entry Id", strategy.short)


// Copy below code to end of the desired strategy script
///////////////////////////////////////////////////////////////////////////////////////////////////////////////////////
//                                 monthly pnl performance  by Dr. Maurya @MAURYA_ALGO_TRADER                        //
///////////////////////////////////////////////////////////////////////////////////////////////////////////////////////
show_performance = input.bool(true, 'Show Monthly Monthly Performance ?', group='Monthly Performance')

dash_loc_mp = input("Bottom Right","Location"  ,options=["Top Right","Bottom Right","Top Left","Bottom Left", "Middle Right","Bottom Center"]  ,group='Monthly Performance', inline = "performance")

text_size_mp = input('Small',"Size"  ,options=["Tiny","Small","Normal","Large"]  ,group='Monthly Performance', inline = "performance")

var table_position_mp = dash_loc_mp == 'Top Left' ? position.top_left :
  dash_loc_mp == 'Bottom Left' ? position.bottom_left :
  dash_loc_mp == 'Middle Right' ? position.middle_right :
  dash_loc_mp == 'Bottom Center' ? position.bottom_center :
  dash_loc_mp == 'Top Right' ? position.top_right : position.bottom_right

var table_text_size_mp = text_size_mp == 'Tiny' ? size.tiny :
  text_size_mp == 'Small' ? size.small :
  text_size_mp == 'Normal' ? size.normal : size.large

/////////////////
text_c = color.white

/////////////////////////////////////////////

// var bool new_month = na
new_month = ta.change(month) //> 0 ? true : false
newest_month = new_month and strategy.closedtrades >= 1
strategy.initial_capital = 50000
// profit
only_profit = strategy.netprofit
initial_balance = strategy.initial_capital

// month number
var int month_number = na
month_number := (ta.valuewhen(newest_month, month(time), 0)) //and month(time) > 1 ? (ta.valuewhen(newest_month, month(time), 0) - 1) :  12 //1 to 12

//month_year
var int month_time = na
month_time := ta.valuewhen(newest_month, time, 0) - 2419200000


var int m_counter = 0
if newest_month
    m_counter += 1


// current month values
var bool new_year = na
new_year := ta.change(year)
curr_m_pnl = only_profit - nz(ta.valuewhen(newest_month, only_profit, 0), 0)
curr_m_number = newest_month ? ta.valuewhen(newest_month, month(time), 0) : month(time)
curr_y_pnl = (only_profit - nz(ta.valuewhen(new_year, only_profit, 0),0))


var float [] net_profit_array = array.new_float()
var int [] month_array = array.new_int()
var int [] month_time_array = array.new_int()


if newest_month
    array.push(net_profit_array, only_profit)
    array.push(month_array, month_number)
    array.push(month_time_array, month_time)


var float [] y_pnl_array = array.new_float()
var int [] y_number_array = array.new_int()
var int [] y_time_array = array.new_int()

newest_year = ta.change(year) and strategy.closedtrades >= 1
get_yearly_pnl = nz(ta.valuewhen(newest_year, strategy.netprofit, 0) - nz(ta.valuewhen(newest_year, strategy.netprofit, 1), 0), 0)
get_m_year = ta.valuewhen(newest_year, year(time), 1)
get_y_time = ta.valuewhen(newest_year, time, 0)

if newest_year
    array.push(y_pnl_array, get_yearly_pnl)
    array.push(y_number_array, get_m_year)
    array.push(y_time_array, get_y_time)
var float monthly_profit = na
var int column_month_number = na
var int row_month_time = na


var testTable = table.new(position = table_position_mp, columns = 14, rows = 40, bgcolor = color.rgb(7, 226, 242, 38), border_color = color.white, border_width = 1)
if barstate.islastconfirmedhistory and show_performance
    table.cell(table_id = testTable, column = 0, row = 0, text = "YEAR", text_color = text_c, text_size=table_text_size_mp)
    table.cell(table_id = testTable, column = 1, row = 0, text = "JAN", text_color = text_c, text_size=table_text_size_mp)
    table.cell(table_id = testTable, column = 2, row = 0, text = "FEB", text_color = text_c, text_size=table_text_size_mp)
    table.cell(table_id = testTable, column = 3, row = 0, text = "MAR", text_color = text_c, text_size=table_text_size_mp)
    table.cell(table_id = testTable, column = 4, row = 0, text = "APR", text_color = text_c, text_size=table_text_size_mp)
    table.cell(table_id = testTable, column = 5, row = 0, text = "MAY", text_color = text_c, text_size=table_text_size_mp)
    table.cell(table_id = testTable, column = 6, row = 0, text = "JUN", text_color = text_c, text_size=table_text_size_mp)
    table.cell(table_id = testTable, column = 7, row = 0, text = "JUL", text_color = text_c, text_size=table_text_size_mp)
    table.cell(table_id = testTable, column = 8, row = 0, text = "AUG", text_color = text_c, text_size=table_text_size_mp)
    table.cell(table_id = testTable, column = 9, row = 0, text = "SEP", text_color = text_c, text_size=table_text_size_mp)
    table.cell(table_id = testTable, column = 10, row = 0, text = "OCT", text_color = text_c, text_size=table_text_size_mp)
    table.cell(table_id = testTable, column = 11, row = 0, text = "NOV", text_color = text_c, text_size=table_text_size_mp)
    table.cell(table_id = testTable, column = 12, row = 0, text = "DEC", text_color = text_c, text_size=table_text_size_mp)
    table.cell(table_id = testTable, column = 13, row = 0, text = "YEAR P/L", text_color = text_c, text_size=table_text_size_mp)

    for i = 0 to (array.size(y_number_array) == 0 ? na : array.size(y_number_array) - 1)
        row_y = year(array.get(y_time_array, i)) - year(array.get(y_time_array, 0)) + 1
        table.cell(table_id = testTable, column = 13, row = row_y, text = str.tostring(array.get(y_pnl_array , i), "##.##") + '\n' + '(' + str.tostring(array.get(y_pnl_array , i)*100/initial_balance, "##.##") + ' %)', bgcolor = array.get(y_pnl_array , i) > 0 ? color.green : array.get(y_pnl_array , i) < 0 ? color.red : color.gray, text_color = color.rgb(0, 0, 0), text_size=table_text_size_mp)
    curr_row_y = array.size(month_time_array) == 0 ? 1 : (year(array.get(month_time_array, array.size(month_time_array) - 1))) - (year(array.get(month_time_array, 0))) + 1
    table.cell(table_id = testTable, column = 13, row = curr_row_y, text = str.tostring(curr_y_pnl, "##.##") + '\n' + '(' + str.tostring(curr_y_pnl*100/initial_balance, "##.##") + ' %)', bgcolor = curr_y_pnl > 0 ? color.green : curr_y_pnl < 0 ? color.red : color.gray, text_color = color.rgb(0, 0, 0), text_size=table_text_size_mp)


    for i = 0 to (array.size(net_profit_array) == 0 ? na : array.size(net_profit_array) - 1)
        monthly_profit := i > 0 ? ( array.get(net_profit_array, i) - array.get(net_profit_array, i - 1) ) : array.get(net_profit_array, i)
        column_month_number := month(array.get(month_time_array, i))
        row_month_time :=((year(array.get(month_time_array, i))) - year(array.get(month_time_array, 0)) ) + 1
        table.cell(table_id = testTable, column = column_month_number, row = row_month_time, text = str.tostring(monthly_profit, "##.##") + '\n' + '(' + str.tostring(monthly_profit*100/initial_balance, "##.##") + ' %)', bgcolor = monthly_profit > 0 ? color.green : monthly_profit < 0 ? color.red : color.gray, text_color = text_c, text_size=table_text_size_mp)
        table.cell(table_id = testTable, column = 0, row =row_month_time, text = str.tostring(year(array.get(month_time_array, i)), "##.##"), text_color = text_c, text_size=table_text_size_mp)

    curr_row_m = array.size(month_time_array) == 0 ? 1 : (year(array.get(month_time_array, array.size(month_time_array) - 1))) - (year(array.get(month_time_array, 0))) + 1
    table.cell(table_id = testTable, column = curr_m_number, row = curr_row_m, text = str.tostring(curr_m_pnl, "##.##") + '\n' + '(' + str.tostring(curr_m_pnl*100/initial_balance, "##.##") + ' %)', bgcolor = curr_m_pnl > 0 ? color.green : curr_m_pnl < 0 ? color.red : color.gray, text_color = text_c, text_size=table_text_size_mp)
    table.cell(table_id = testTable, column = 0, row =curr_row_m, text = str.tostring(year(time), "##.##"), text_color = text_c, text_size=table_text_size_mp)

//============================================================================================================================================================================