概述
该策略是一个基于双均线的震荡交易策略。它使用快速移动平均线和慢速移动平均线的交叉作为买入和卖出信号。当快速移动平均线从下方上穿慢速移动平均线时生成买入信号;当快速移动平均线从上方下穿慢速移动平均线时生成卖出信号。该策略适用于震荡行情,可以捕捉价格的短期波动获利。
策略原理
该策略使用 length 为 6 的 RMA 作为快速移动平均线,length 为 4 的 HMA 作为慢速移动平均线。策略通过快速线和慢速线的交叉判断价格趋势和生成交易信号。
当快速线从下方上穿慢速线时,表示价格短期内由跌转涨,属于筹码转换的时机,因此策略在此时产生买入信号;当快速线从上方下穿慢速线时,表示价格短期内由涨转跌,属于筹码转换的时机,因此策略在此时产生卖出信号。
此外,策略还检测长期趋势判断,以避免逆势交易。只有当长期趋势判断也同时赞成该信号时,才会生成实际的买入和卖出信号。
策略优势
该策略具有如下优势:
- 使用双均线交叉判断,可以有效识别短期价格反转点。
- 快速线和慢速线长度搭配合理,可以产生较准确的交易信号。
- 结合长短期趋势判断,可以过滤掉大部分噪音交易信号。
- 实现了止盈止损逻辑,可以主动规避风险。
- 易于理解和实现,适合量化交易初学者。
风险及解决方法
该策略也存在一些风险:
双均线策略容易产生多次小额盈利但一次大额亏损的情况。解决方法是适当调整止盈止损水平。
震荡行情中交易信号频繁,可能导致过度交易。解决方法是适当放宽交易条件,减少 transactions。
策略参数容易过度优化,实盘效果可能不佳。解决方法是参数稳健性测试。
策略在趋势行情中表现不佳。解决方法是增加趋势判断模块或与趋势策略组合使用。
优化方向
该策略可进一步优化的方向包括:
更新均线指标,使用 Kalman 等自适应滤波器。
增加机器学习模块,利用 AI 训练判断买卖点。
增加资金管理模块,使风险控制更加自动化。
与高频因子结合,找到更强交易信号。
多品种跨市场套利。
总结
该双均线震荡策略整体来说是一个典型且实用的量化交易策略。它具有较强的适应性,初学者可以从中学习大量关于策略开发的知识。与此同时,它也有很大的改进空间,可进一步结合更多量化技巧进行优化,从而获得更好的策略效果。
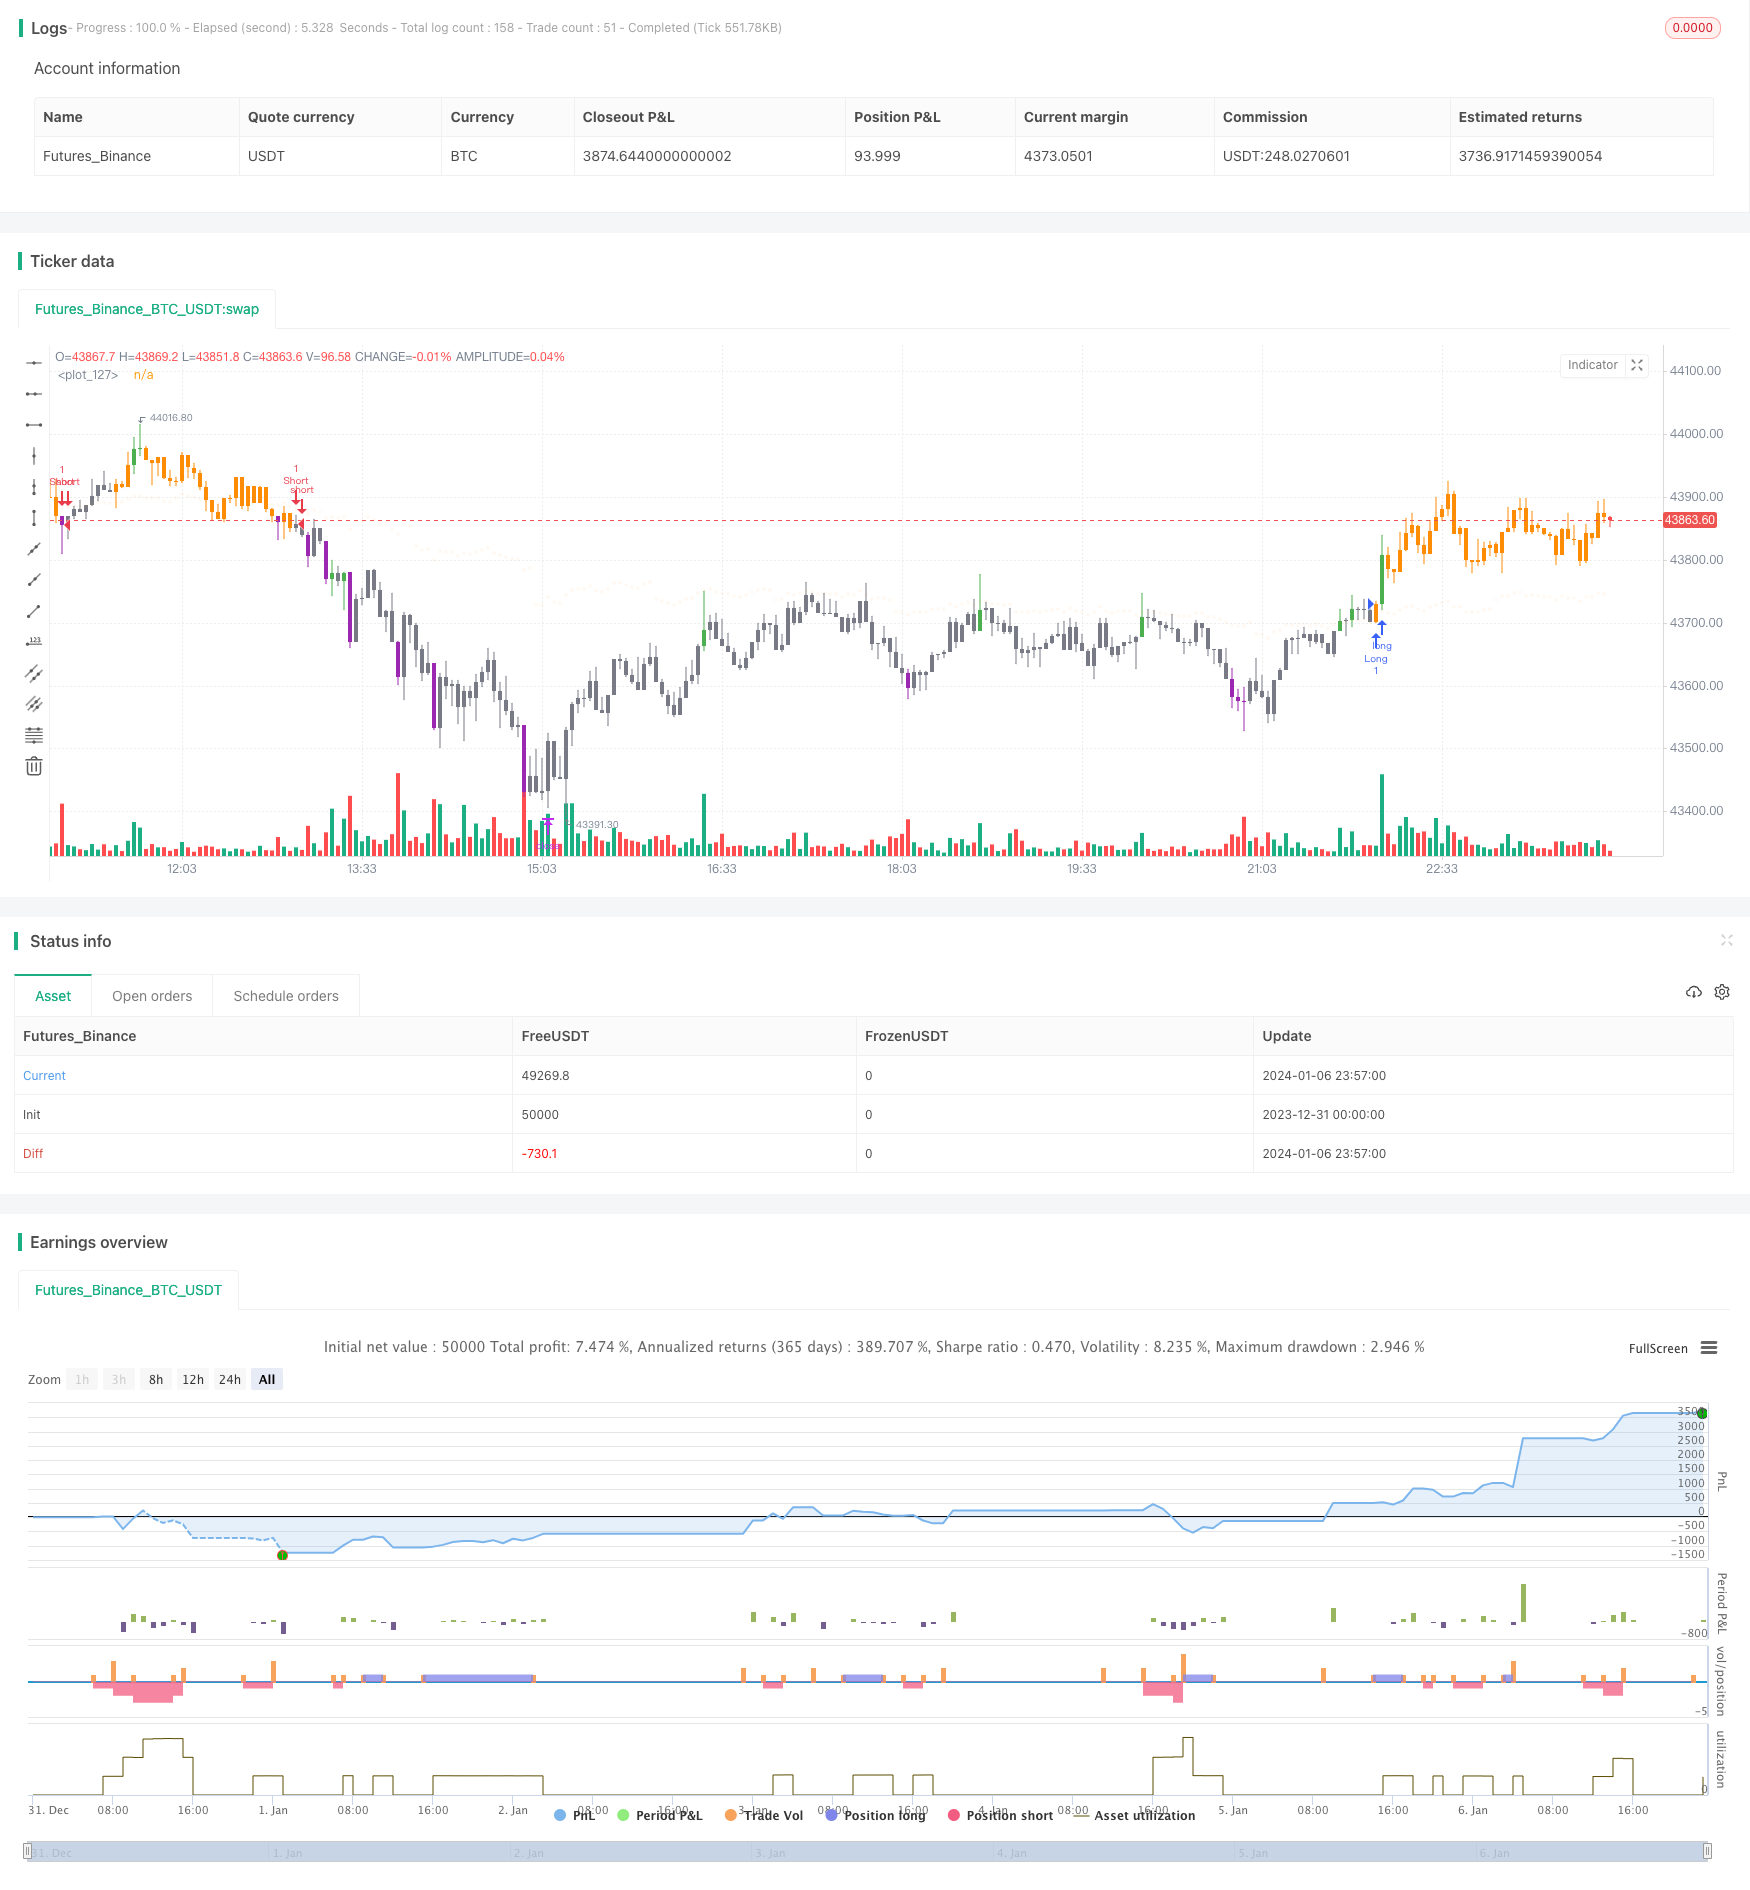
/*backtest
start: 2023-12-31 00:00:00
end: 2024-01-07 00:00:00
period: 3m
basePeriod: 1m
exchanges: [{"eid":"Futures_Binance","currency":"BTC_USDT"}]
*/

// This source code is subject to the terms of the Mozilla Public License 2.0 at https://mozilla.org/MPL/2.0/
// © dc_analytics
// https://datacryptoanalytics.com/


//@version=5
strategy("Scalping Trading", overlay=true)

//  INPUTS  //
bar_color       = input(true, title='Bar Color', group='⚙ Settings',tooltip='Color chart bars.', inline = "1")
mostrar         = input(true, 'Show Alerts', group='⚙ Settings', inline = "1")
tempo           = input.timeframe('60', group='⚙ Settings', title='🕗 Timeframe', options=['1', '5', '15', '30', '60', '120', '240', '360', '720', 'D', 'W'])

i_position      = input.string("Bottom Center", title = "⚙ D-Panel Location",
 options = ["Top Right", "Bottom Center", "Bottom Right"], group='⚙ D-Panel Settings️',
 tooltip='Choose the location of the information table on the chart.(D-Panel) ')

position        = i_position == "Top Right" ? position.top_right : i_position == "Bottom Center" ? position.bottom_center : position.bottom_right

i_tam           = input.string('Big', title = '⚙ D-Painel Size',
 options = ["Tiny", "Small", "Big"], group='⚙ D-Panel Settings️',tooltip='Choose the size of the information panel (D-Panel).')

tamanho         = i_tam == "Tiny" ? size.tiny : i_tam == "Small" ? size.small : size.normal

show_tp_sl      = input(true, title='Show Take Profit/Stop Loss', group='⚙ Settings',tooltip='Show Take Profit/Stop Loss.')
TP              = input.float(defval=4500, title='Take Profit:',group='⚙ Risk Management',tooltip='Choose amount of profit')
SL              = input.float(defval=2500, title='Stop Loss:', group='⚙ Risk Management',tooltip='Choose amount of loss')
//  END INPUTS  //


//  DECLARATIONS  //
t_up    = '📈'
t_down  = '📉'

c_buy   = 'Long ⇡'
c_sell  = 'Short ⇣'

// _DECLARATION TREND
t_sma       = ta.hma(close, 200)
tend_sma    = ta.sma(close, 12)

tendencia   = request.security(syminfo.tickerid, timeframe.period, t_sma, barmerge.gaps_off, barmerge.lookahead_off)
tend_tabela = request.security(syminfo.tickerid, timeframe.period, tend_sma, barmerge.gaps_off, barmerge.lookahead_off)
// _END DECLARATION TREND

circle = plot.style_circles
//  END DECLARATIONS  //


//  COLORS  //
color gray   = color.gray
color red    = color.new(#ff8c05, 0)
color orange = color.new(#ff8c05, 0)
color silver = color.silver
color up_vol = color.new(color.green, 0)
color dn_vol = color.new(color.purple, 0)

color orange_tranp  = color.new(#ff8c05, 95)
// END COLORS //

//  SCANNER MARKET MAKERS  //
periodo  = input.int(20, 'Period Volume', group='⚙️ Scanner Market Makers Settings')
fator    = input.float(1.85, 'Proportion to the mean: (1.25 = 125% of the mean)', minval=0, group='⚙️ Scanner Market Makers Settings')
vol_up   = close > open
vol_down = open > close
vol      = volume
pesado   = volume > ta.ema(volume, periodo) * fator

palette  = pesado and vol_up ? gray : pesado and vol_down ? orange : vol_up ? silver : gray
//  END SCANNER MARKET MAKERS  //


//  LOGIC ONE  //
s = ta.rma(close, 6)
v = ta.hma(close, 4)

//  TREND
t_baixa     = tendencia > tendencia[1]
t_alta      = tendencia < tendencia[1]

te_d        = tend_tabela > tend_tabela[1]
trend       = te_d ? t_up : t_down
//  END TREND

a = request.security(syminfo.tickerid, tempo, s)
b = request.security(syminfo.tickerid, tempo, ohlc4)

c_dn   = a > b and a[1] < b[1]
c_up   = b > a and b[1] < a[1]

compra = mostrar and c_up ? a : na
venda  = mostrar and c_dn ? a : na

s_sell = venda and t_alta
s_buy  = compra and t_baixa
c_vela = b > a and te_d ? gray : orange

s_up = false
s_dw = false

b_sinal = not s_up and s_buy
s_sinal = not s_dw and s_sell

if b_sinal
    s_dw := false
    s_up := true
    s_up

if s_sinal
    s_dw := true
    s_up := false
    s_up

// END LOGIC ONE //


//  DATA TABLE  //
c = b > a ? orange : gray
c_sinal = b > a ? c_buy : c_sell
//  END DATA TABLE  //


//  PLOT/BARCOLOR  //
c_barcolor = pesado and vol_up ? up_vol : pesado and vol_down ? dn_vol : vol_up ? c : c

barcolor(bar_color ? c_barcolor : na)
plot(a, color=orange_tranp, style=circle)
//  END PLOT/BARCOLOR  //


//  TABLE  //
var dash = table.new(position=position, columns=2, rows=3, border_width=1)
if barstate.islast
    table.cell(table_id=dash, column=1, row=2, text='Scalping DCA', bgcolor=orange)
    table.cell(table_id=dash, column=1, row=0, text='Trade: ' + c_sinal)
    table.cell(table_id=dash, column=1, row=1, text='Trend: ' + trend)
//  END TABLE  //


//  SETTINGS STRATEGY  //
exitPrice = strategy.closedtrades.exit_price(strategy.closedtrades - 1)

// OPEN ORDER
if (b_sinal)
    strategy.order("Long", strategy.long , comment = "Entry: " + str.tostring(close, "#.####"))
//    strategy.exit("EXIT", trail_points = 1000, trail_offset = 0, comment_trailing = "Close with Profit: " + str.tostring(close, "#.####"))
//    strategy.entry("long", strategy.long)

if (s_sinal)
    strategy.order("Short", strategy.short , comment = "Entry: " + str.tostring(close, "#.####"))
//    strategy.exit("EXIT", trail_points = 1000, trail_offset = 0, comment_trailing = "Close with Profit: " + str.tostring(close, "#.####"))
//    strategy.entry("short", strategy.short)

//  TP/SL ORDERS
if strategy.position_size > 0
    strategy.exit('Long_Close', 'Long',profit = TP , loss=SL, qty_percent=100, comment_profit = "Profit Long: " + str.tostring(exitPrice, "#.####"), comment_loss = "Stop Long: " + str.tostring(exitPrice, "#.####"))
//if  strategy.position_size > 0
//    strategy.exit("Long", "Long", stop = longSL, limit = longTP, comment_profit = "Profit Long: " + str.tostring(exitPrice, "#.####"), comment_loss = "Stop Long: " + str.tostring(exitPrice, "#.####"))

if strategy.position_size < 0
    strategy.exit('Short_Close', 'Short',profit = TP, loss=SL, qty_percent=100, comment_profit = "Profit Short: " + str.tostring(exitPrice, "#.####"), comment_loss = "Stop Short: " + str.tostring(exitPrice, "#.####"))
//if strategy.position_size < 0
//    strategy.exit("Short", "Short", stop = shortSL, limit = shortTP, comment_profit = "Profit Short: "+ str.tostring(exitPrice, "#.####"), comment_loss = "Stop Short: " + str.tostring(exitPrice, "#.####"))

//  END SETTINGS STRATEGY  //

// LOGS
// if strategy.opentrades > 10
//     log.warning("{0} positions opened in the same direction in a row. Try adjusting `bracketTickSizeInput`", strategy.opentrades)

// last10Perc = strategy.initial_capital / 10 > strategy.equity
// if (last10Perc and not last10Perc[1])
//     log.error("The strategy has lost 90% of the initial capital!")