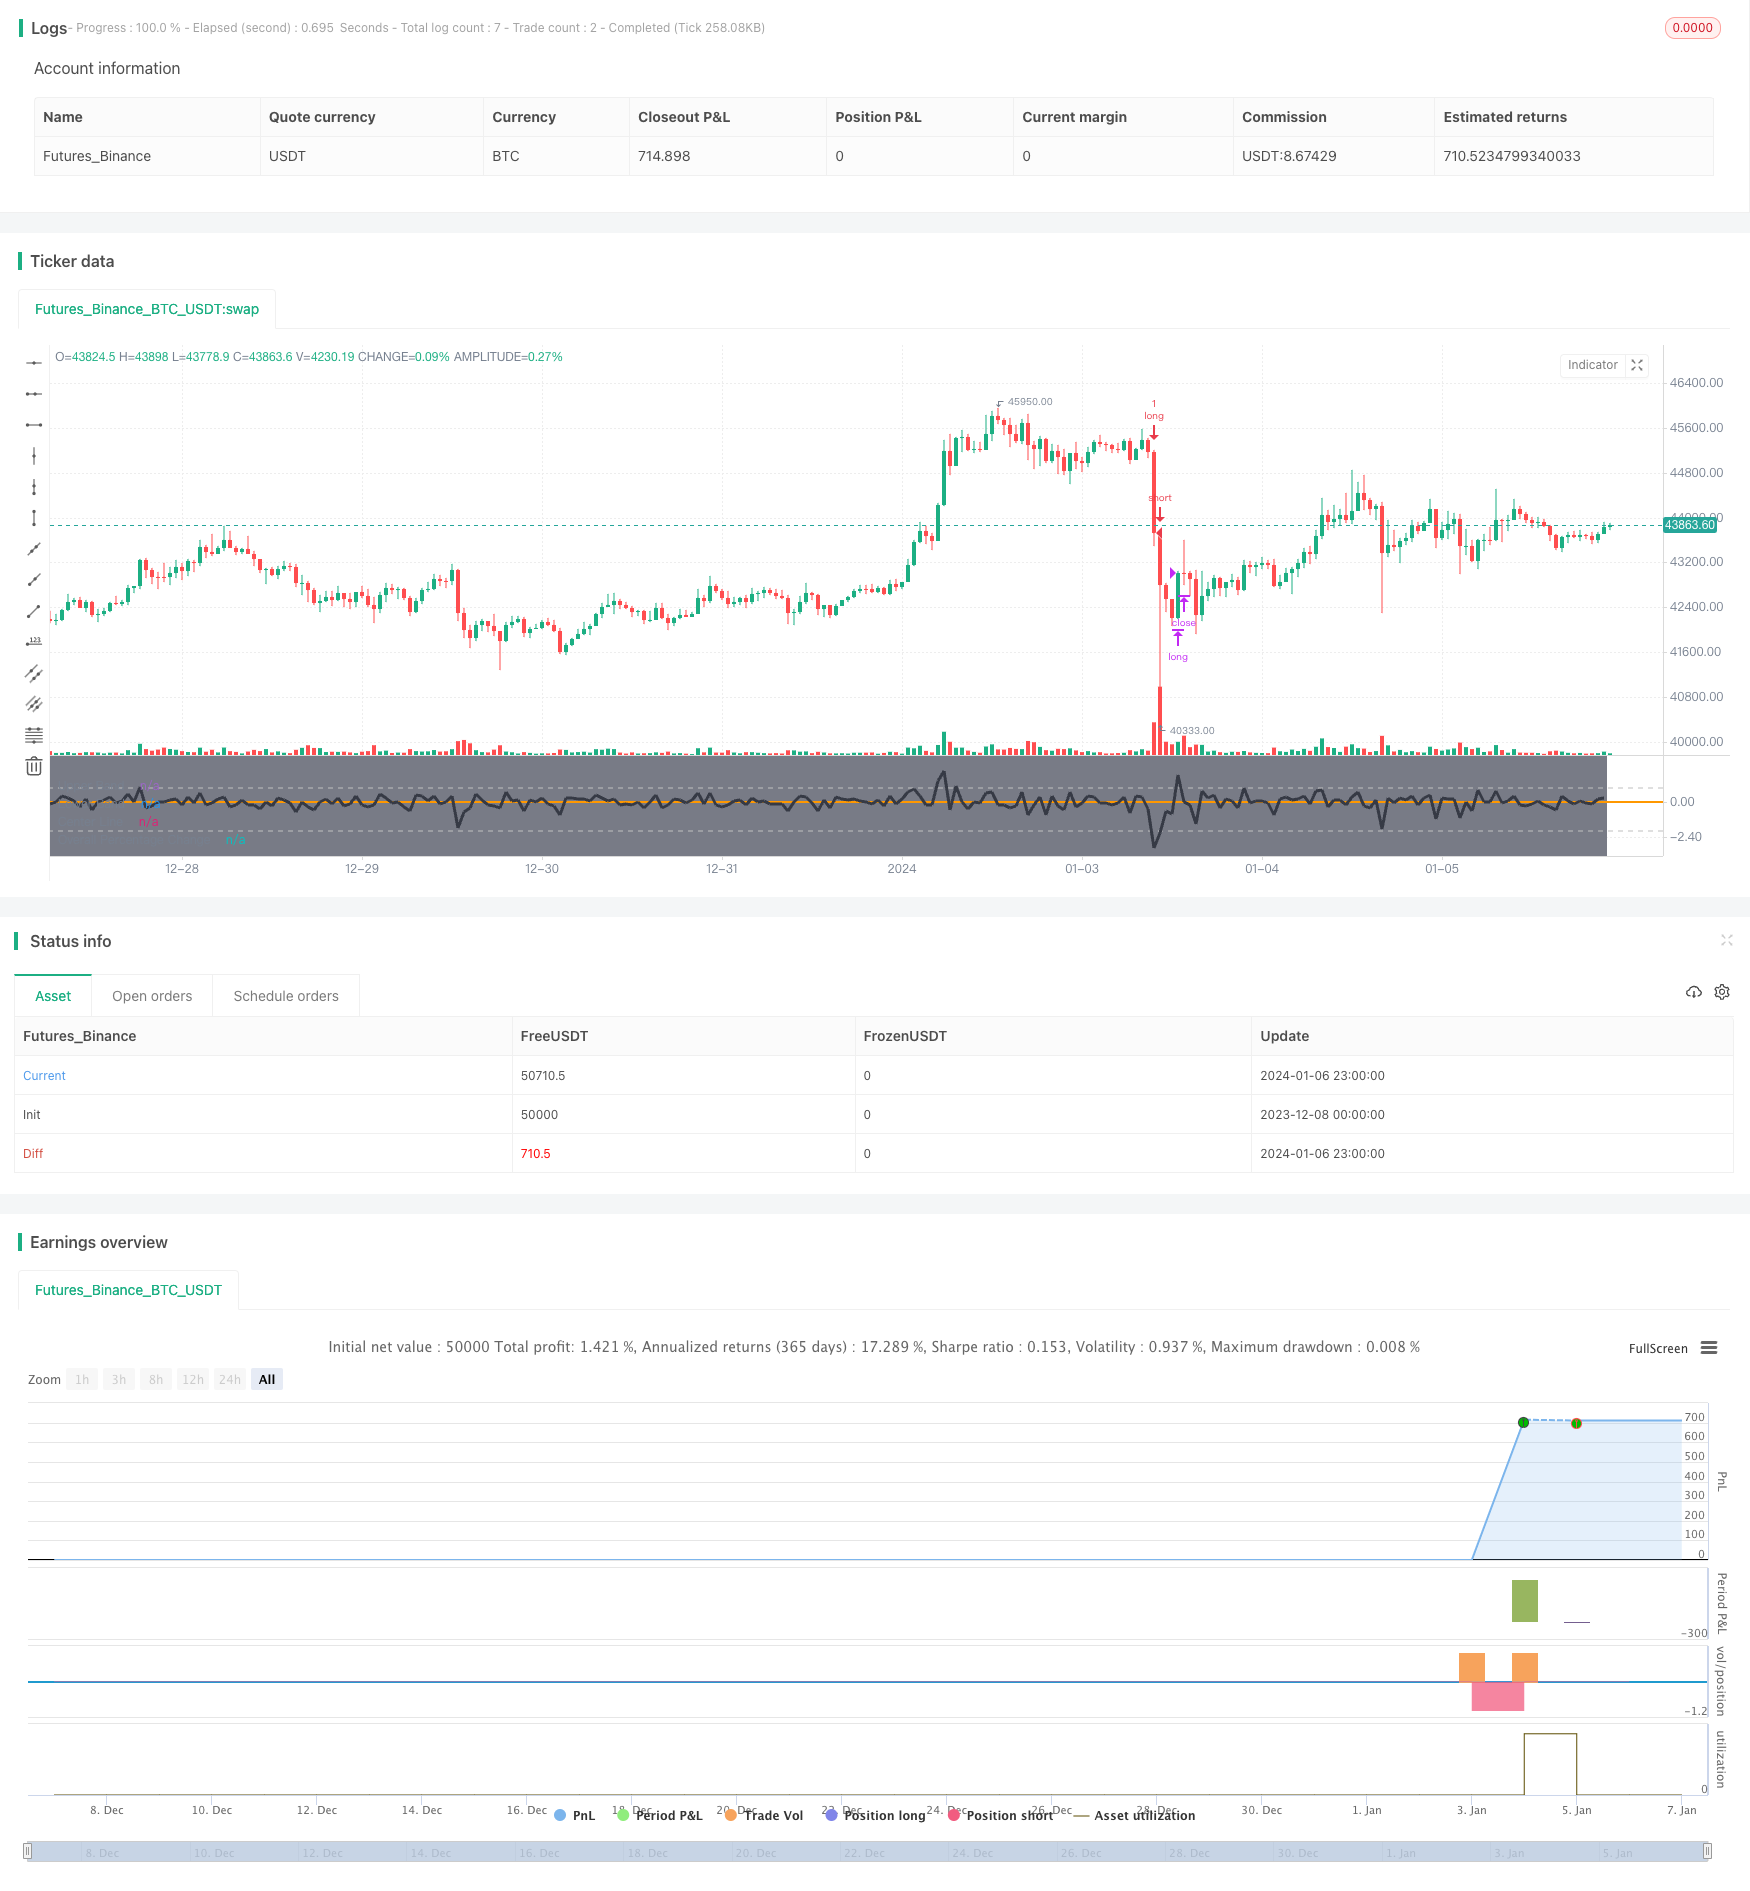
概述
该策略将逆向交易方法(买入低点)与趋势跟踪逻辑(只有当价格高于MA200时)相结合。策略旨在找到购买资产低点时获利最可能的最佳时机。长期移动平均线上方的价格表示提高了从购买短期价格疲软的资产中获利的可能性。
策略原理
该策略通过计算价格在回顾期内的总体变化百分比,来判断价格是否处于相对低点。当总体变化百分比小于-3%时,认为价格处于低点。此外,策略还设置了200天简单移动平均线作为判断趋势的指标。只有当价格高于200天移动平均线时,才会发出买入信号。这样,策略同时利用MEAN回归原理,以及多空配对原理,在趋势向上时买入低点,实现获利。
优势分析
该策略结合了趋势交易和逆向交易的优点。一方面,使用长期移动平均线判断趋势,避免在趋势下降期间盲目买入。另一方面,逆向买入低点又使其能在短期调整的时候获得较好的入场时机。这两者的结合,既保证了交易的安全性,也提高了获利概率。此外,策略参数优化空间大,可根据不同市场调整参数,具有较强的适应性。
风险分析
该策略最大的风险在于买入信号发出后,价格可能继续下跌,导致亏损扩大。此外,如果市场长期横盘,价格无法突破移动平均线,也会导致策略失效。为降低这些风险,可适当缩短移动平均线周期,并优化买入条件,确保有足够的安全边际。
优化方向
该策略可从以下几个方面进行优化:1)优化移动平均线周期,适应不同市场;2)优化买入条件,确保有足够边际;3)增加止损策略,控制亏损;4)结合其他指标判断趋势及低点,提高准确性。
总结
该策略整体来说是一种典型的结合趋势跟踪和逆向交易思想的策略。它既保证了交易安全性,也提高了获利概率。具有较强的实战价值。通过参数优化和止损策略优化,可以进一步增强策略稳定性和实战效果。
策略源码
/*backtest
start: 2023-12-08 00:00:00
end: 2024-01-07 00:00:00
period: 1h
basePeriod: 15m
exchanges: [{"eid":"Futures_Binance","currency":"BTC_USDT"}]
*/

//@version=4
strategy("Buy The Dips - MA200 Optimised", overlay=false)

//Moving average
MAinp = input(defval = 100, title = "MA", type = input.integer, minval = 1, step = 1)
MA=sma(close, MAinp)

//Percent change
inp_lkb = input(1, title='Lookback Period')

perc_change(lkb) =>
    overall_change = ((close[0] - close[lkb]) / close[lkb]) * 100

// Call the function
overall = perc_change(inp_lkb)

// === INPUT BACKTEST RANGE ===
fromMonth = input(defval = 1,    title = "From Month",      type = input.integer, minval = 1, maxval = 12)
fromDay   = input(defval = 1,    title = "From Day",        type = input.integer, minval = 1, maxval = 31)
fromYear  = input(defval = 2020, title = "From Year",       type = input.integer, minval = 1970)
thruMonth = input(defval = 1,    title = "Thru Month",      type = input.integer, minval = 1, maxval = 12)
thruDay   = input(defval = 1,    title = "Thru Day",        type = input.integer, minval = 1, maxval = 31)
thruYear  = input(defval = 2112, title = "Thru Year",       type = input.integer, minval = 1970)

showDate  = input(defval = true, title = "Show Date Range", type = input.bool)

start     = timestamp(fromYear, fromMonth, fromDay, 00, 00)        // backtest start window
finish    = timestamp(thruYear, thruMonth, thruDay, 23, 59)        // backtest finish window
window()  => true       // create function "within window of time"

//Entry/Exit
strategy.entry(id="long", long = true, when = window() and overall<-3 and close > MA)
strategy.close(id="long", when = window() and overall>1)


bgcolor(color = showDate and window() ? color.gray : na, transp = 90)
plot(overall, color=color.black, title='Overall Percentage Change', linewidth=3)
band1 = hline(1, "Upper Band", color=#C0C0C0)
band0 = hline(-2, "Lower Band", color=#C0C0C0)
fill(band1, band0, color=#9915FF, transp=90, title="Background")
hline(0, title='Center Line', color=color.orange, linestyle=hline.style_solid, linewidth=2)