概述
该策略的主要思想是结合支撑阻力位和成交量的突破来确定入场时机,并使用ATR指标实现获利后动态调整止损追踪价格,从而获取更多的潜在利润。
策略原理
该策略主要由以下几部分逻辑组成:
使用ta.pivothigh和ta.pivotlow函数计算出L_Bars根K线的最高价和R_Bars根K线的最低价,作为阻力线和支撑线。
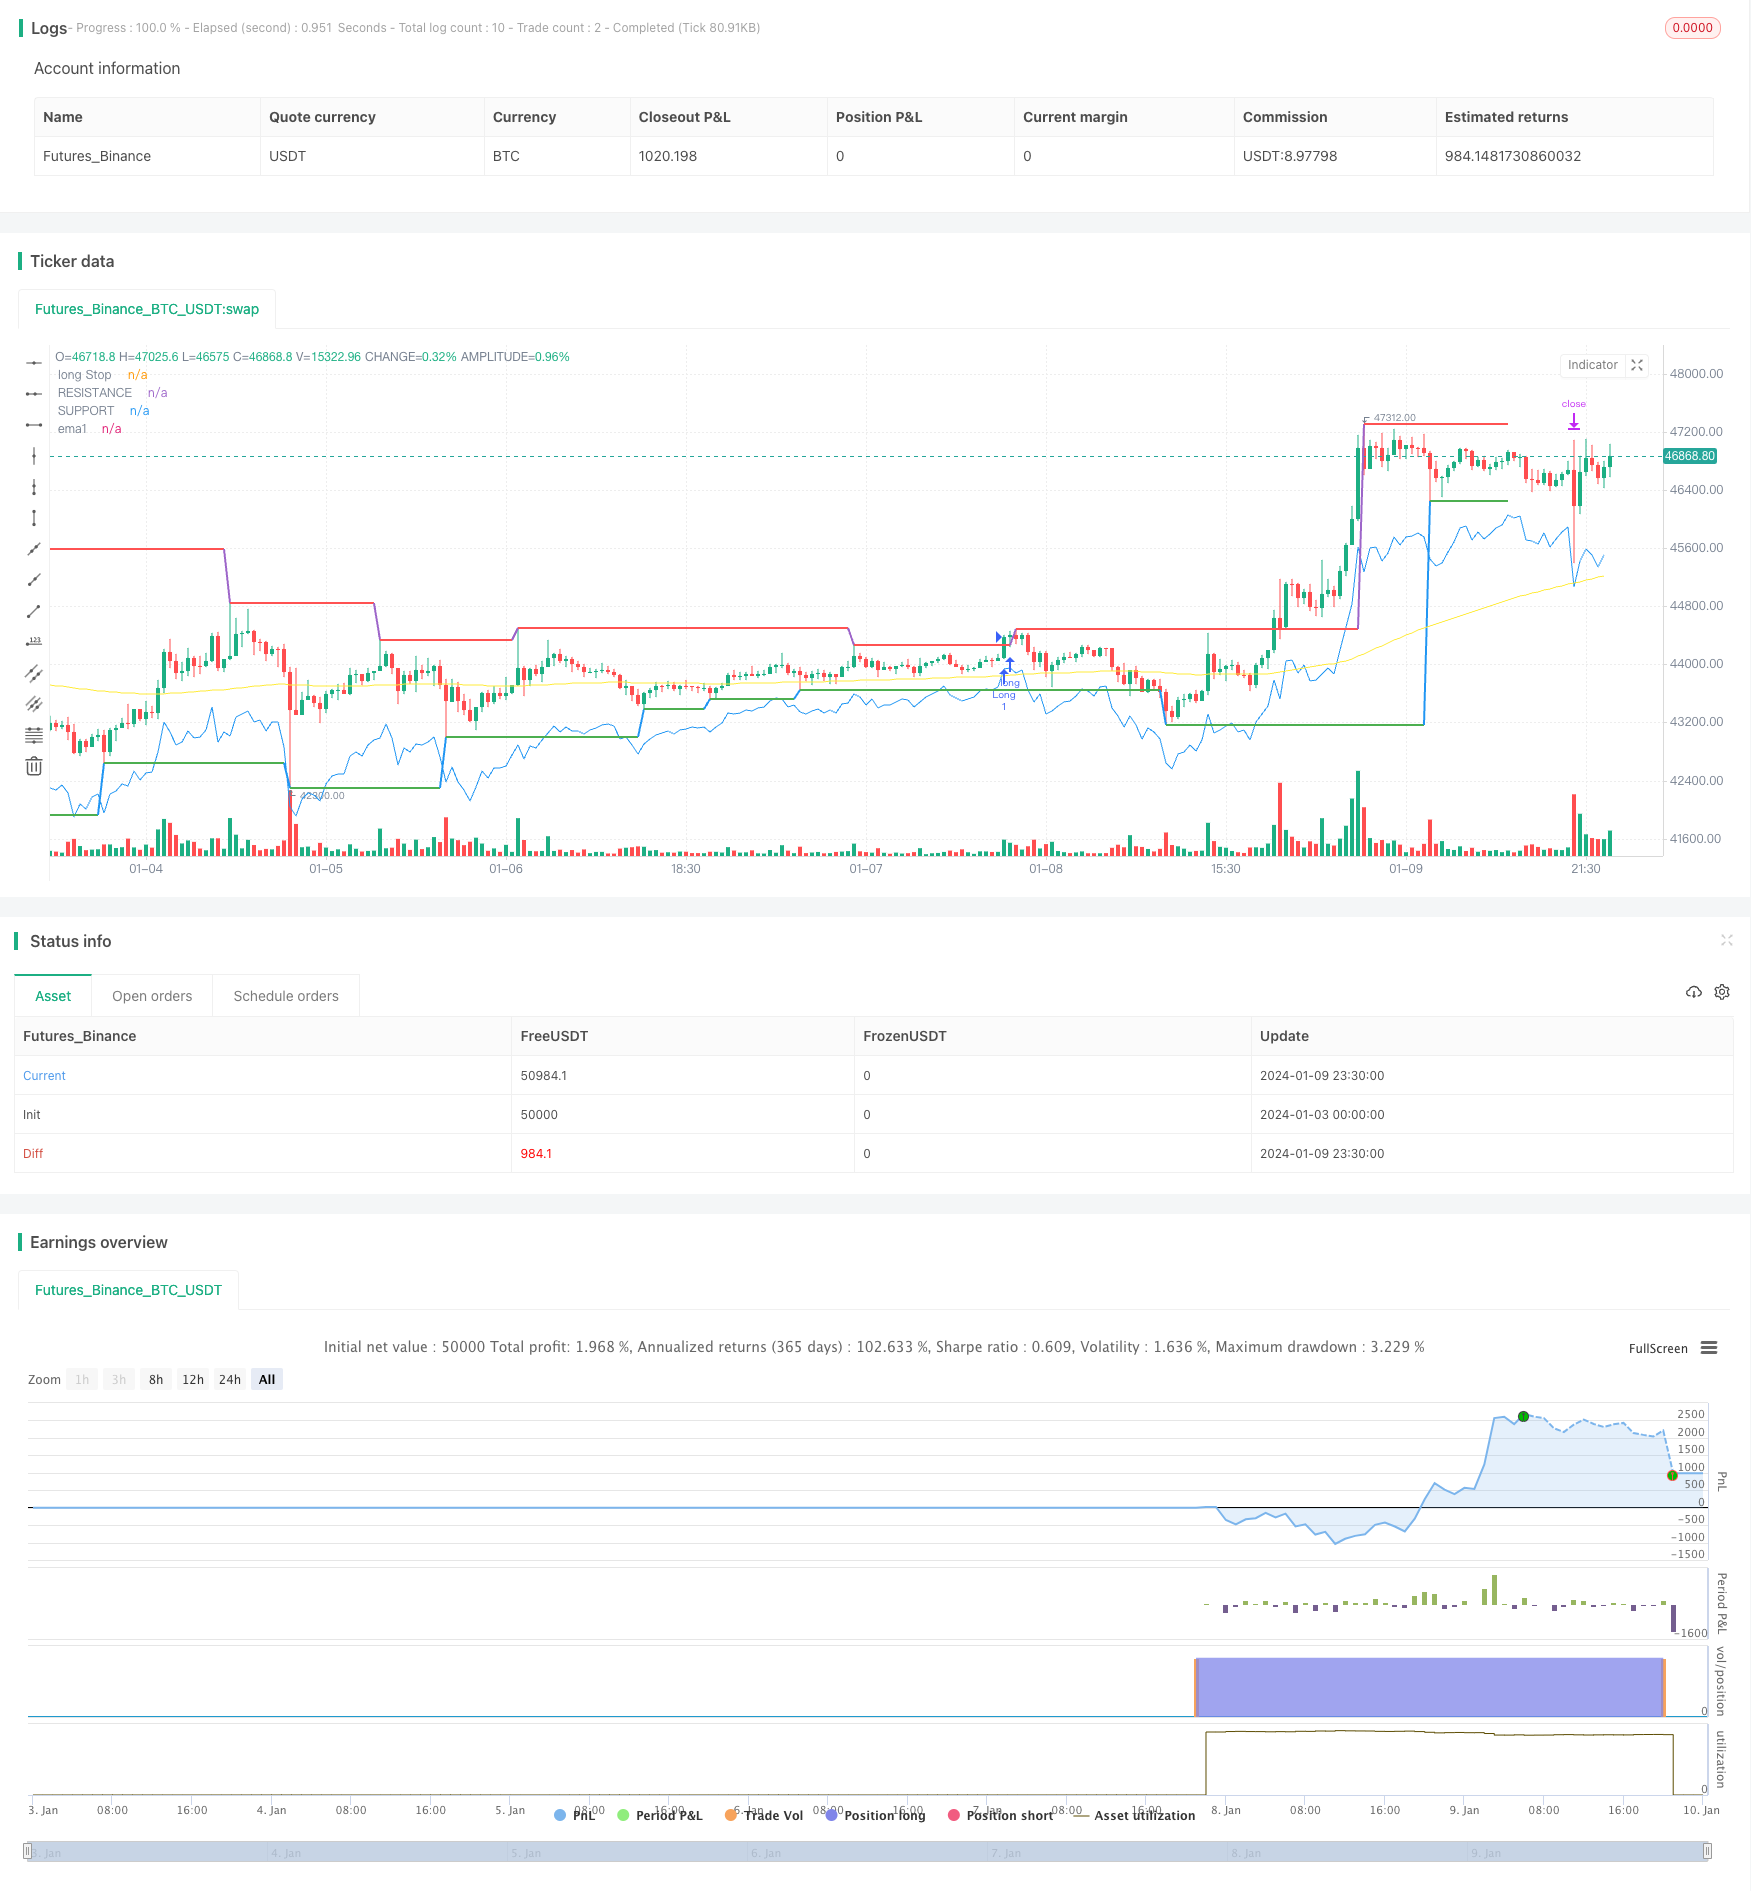
当收盘价上穿阻力线且成交量突破volumeRange的阈值时,做多;当收盘价下穿支撑线且成交量突破volumeRange的阈值时,做空。
做多之后,以close-ATR_LO作为长止损;做空之后,以close+ATR_SH作为短止损,实现动态调整跟踪止损。
在交易时间内(0915-1445),每天做第一个交易信号,收益或亏损达到risk的额度后不再开新单。
策略优势
运用支撑阻力理论,结合成交量指标,使入场时机更加精准。
使用ATR指标跟踪止损,能够根据市场波动程度来灵活调整止损位置,实现获利后降低盈利回吐的可能。
适当控制单日交易次数和单笔交易风险,有助于把握趋势,避免止损过多。
策略风险
支撑阻力可能失效,无法提供有效的入场信号。
ATR指标设定过大,可能导致止损距离过远,增加亏损风险。
成交量指标设定过小,可能导致错过机会;设定过大,可能导致误判信号。
解决方法:
根据不同品种特点,调整支撑阻力参数
优化ATR倍数和成交量阈值参数
结合其他指标判断入场时机
策略优化方向
结合其他指标判断入场时机,例如移动平均线等
对ATR倍数和成交量阈值参数进行优化
结合机器学习算法实现动态参数优化
扩展到其他品种,寻找参数规律
总结
该策略整合了多种分析工具,通过对支撑阻力、成交量和止损方法的运用,实现了回测阶段较好的效果。但实盘中可能会面临更多不确定性,需要通过参数优化和引入其他判断指标来进一步增强实盘表现。总的来说,该策略思路清晰、易于理解,为量化交易策略提供了一个很好的参考案例。
/*backtest
start: 2024-01-03 00:00:00
end: 2024-01-10 00:00:00
period: 30m
basePeriod: 15m
exchanges: [{"eid":"Futures_Binance","currency":"BTC_USDT"}]
*/

//   ____________                _________                      _____________
//  |____________|             ||________|                      ||__________|
//       ||            ____    ||        ||                     ||                    ______ ________    _____ ________
//       ||    |   || ||       ||________|| |   || ||    ||     ||     |   ||   /\\   |   // |______| || ||    |______|
//       ||    |===|| |===     ||__________ |   || ||    ||     ||     |===||  /__\\  |===      ||    ||   \\     ||
//       ||    |   || ||___    ||        || |___|| ||___ ||___  ||     |   || /    \\ |   \\    ||    || ___||    ||
//       ||                    ||________||                     ||__________
//       ||                    ||________|                      ||__________|

//@version=5
strategy("SUPPORT RESISTANCE STRATEGY [5MIN TF]",overlay=true )
L_Bars = input.int(defval = 10, minval = 1 , maxval = 50, step =1)
R_Bars = input.int(defval = 15, minval = 1 , maxval = 50, step =1)
volumeRange = input.int(20, title='Volume Break [threshold]', minval = 1)

// ═══════════════════════════ //
// ——————————> INPUT <——————— //
// ═══════════════════════════ //

EMA1 = input.int(title='PRICE CROSS EMA', defval = 150, minval = 10 ,maxval = 400)
factor1 = input.float(title='_ATR LONG',defval = 3.2 , minval = 1 , maxval = 5 , step = 0.1, tooltip = "ATR TRAIL LONG")
factor2 = input.float(title='_ATR SHORT',defval = 3.2 , minval = 1 , maxval = 5 , step = 0.1, tooltip = "ATR TRAIL SHORT")
risk = input.float(title='RISK',defval = 200 , minval = 1 , maxval = 5000 , step = 50, tooltip = "RISK PER TRADE")


var initialCapital = strategy.equity
t = time(timeframe.period, '0915-1445:1234567')
time_cond = not na(t)

// ══════════════════════════════════ //
// ———————————> EMA DATA <——————————— //
// ══════════════════════════════════ //
ema1 = ta.ema(close, EMA1)

plot(ema1, color=color.new(color.yellow, 0), style=plot.style_linebr, title='ema1')

// ══════════════════════════════════ //
// ————————> TRAIL DATA <———————————— //
// ══════════════════════════════════ //
// *******Calculate LONG TRAIL data*****
ATR_LO = ta.atr(14)*factor1

// *******Calculate SHORT TRAIL data*****
ATR_SH = ta.atr(14)*factor2

long_trail = close - ATR_LO
short_trail = close + ATR_SH

// Plot atr data
//plot(longStop, color=color.new(color.green, 0), style=plot.style_linebr, title='Long Trailing Stop')
//plot(shortStop , color=color.new(color.red, 0), style=plot.style_linebr, title='Short Trailing Stop')

// ══════════════════════════════════════════════════════════════════════════════════════════════════════════════════════════════════════════════════════════════════════════ //
// ————————————————————————————————————————————————————————> RESISTANCE/SUPPORT LEVELS DATA <————————————————————————————————————————————————————————————————————————————————————————————— //
// ══════════════════════════════════════════════════════════════════════════════════════════════════════════════════════════════════════════════════════════════════════════ //

Resistance_pi = fixnan(ta.pivothigh(L_Bars, R_Bars)[1])
Support_pi = fixnan(ta.pivotlow(L_Bars, R_Bars)[1])
r1 = plot(Resistance_pi, color=ta.change(Resistance_pi) ? na : color.red,  offset=-(R_Bars + 1),linewidth=2, title='RESISTANCE')
s1 = plot(Support_pi, color=ta.change(Support_pi) ? na : color.green, offset=-(R_Bars + 1),linewidth=2, title='SUPPORT')

//Volume
vol_1 = ta.ema(volume, 5)
vol_2 = ta.ema(volume, 10)
osc_vol = 100 * (vol_1 - vol_2) / vol_2

// ══════════════════════════════════//
// ————————> LONG POSITIONS <————————//
// ══════════════════════════════════//
//******barinstate.isconfirmed used to avoid repaint in real time*******

if ( ta.crossover(close, Resistance_pi) and osc_vol > volumeRange and not(open - low > close - open) and strategy.opentrades==0 and barstate.isconfirmed and time_cond and close >= ema1 )
    strategy.entry(id= "Long" ,direction = strategy.long, comment = "BUY")

plot(long_trail , color=color.new(color.blue, 0), style=plot.style_linebr, title='long Stop')

if strategy.position_size > 0
    strategy.exit("long tsl", "Long" , stop = long_trail ,comment='SELL')

// ═════════════════════════════════════//
// ————————> SHORT POSITIONS <————————— //
// ═════════════════════════════════════//
if ( ta.crossunder(close, Support_pi) and osc_vol > volumeRange and not(open - close < high - open)  and strategy.opentrades==0 and barstate.isconfirmed and time_cond and close <= ema1 )
    strategy.entry(id = "Short" ,direction = strategy.short,  comment = "SELL")

if strategy.position_size < 0
    strategy.exit("short tsl", "Short" ,  stop = short_trail ,comment='BUY')

// ════════════════════════════════════════════════//
// ————————> CLOSE ALL POSITIONS BY 3PM <————————— //
// ════════════════════════════════════════════════//
strategy.close_all(when = hour == 14 and minute == 55)

// ════════════════════════════════════════//
// ————————> MAX INTRADAY LOSS  <————————— //
// ════════════════════════════════════════//
// strategy.risk.max_intraday_loss(type = strategy.cash, value = risk)