SMA Crossover Based Quantitative Trading Strategy

Author: ChaoZhang, Date: 2024-01-12 10:51:33
Tags:

img

Overview

This strategy calculates SMA lines of different periods to implement golden cross and death cross patterns, thereby generating buy and sell signals. It is a typical trend following strategy.

Strategy Principle

  1. Calculate the 5-day line (sma5), 20-day line (sma20) and 200-day line (sma200) of three SMA lines with different cycles
  2. When the short-cycle moving average crosses above the long-cycle moving average from below, a buy signal is generated
  3. When the short-cycle moving average crosses below the long-cycle moving average from above, a sell signal is generated
  4. Make transactions based on buy and sell signals

Take the crossover between the 5-day line and the 200-day line as an example. When the 5-day line crosses above the 200-day line, it means that the market has entered a short-term bullish outlook and a buy signal is generated. When the 5-day line crosses below the 200-day line, it means the market has entered a short-term bearish outlook and a sell signal is generated. By capturing the cross pattern of moving averages of different cycles, market trends can be captured accordingly.

Advantages of the Strategy

  1. Simple to implement. It only needs to calculate several SMA lines of different cycles and judge entry and exit through simple moving average cross patterns.
  2. Sensitive to overall market trend and can profit from trend effect. For example, when the 5-day line crosses above the 200-day line, the market is in a medium-long term bull state. Buying stocks at this time can ride the uptrend.
  3. Relatively small pullback and loss risk. When the market sees large-scale adjustments, the moving average crossover strategy will promptly issue sell signals to effectively control pullbacks.

Risks and Countermeasures

  1. Easily generate false signals. When the market is range-bound, the moving average may have multiple false crosses, resulting in unnecessary trading frequency and costs. Appropriately adjust the holding cycle to filter out some short-term noise.
  2. The adjustment cycle selection is very critical. If the moving average parameters are improperly selected, the signal effect may be unsatisfactory. Appropriate moving average cycle combinations should be determined according to different varieties.
  3. Unable to cope with unusually large shocks. In the event of major black swan events, the moving average crossover strategy may suffer heavy losses. The strategy should be suspended at this time and manual operation should take over.

Strategy Optimization

  1. Add other indicators for filtration. When the moving average crossover signal appears, also refer to indicators like MACD and KDJ to avoid generating wrong signals in volatile markets.

  2. Combine with trend judgment indicators. For example, use 5-day line and 200-day line to build buy and sell points in this instance. Also combine ADX indicator to judge trend strength and only execute signals when trend is strong enough.

  3. Use adaptive moving average. Adjust moving average parameters in real time based on market conditions and volatility, making trading signals more practical.

  4. Combination across varieties. Apply the strategy to different types of stocks and foreign exchange products to improve overall strategy performance.

Conclusion

This strategy judges market trend simply through SMA crossover patterns, implementing a typical trend following strategy. The advantage lies in its simplicity to operate and ability to effectively capture major trends. While the disadvantage is that it easily generates wrong signals and cannot cope with huge market swings. Future improvements can be made in areas like signal filtration and parameter optimization.


/*backtest
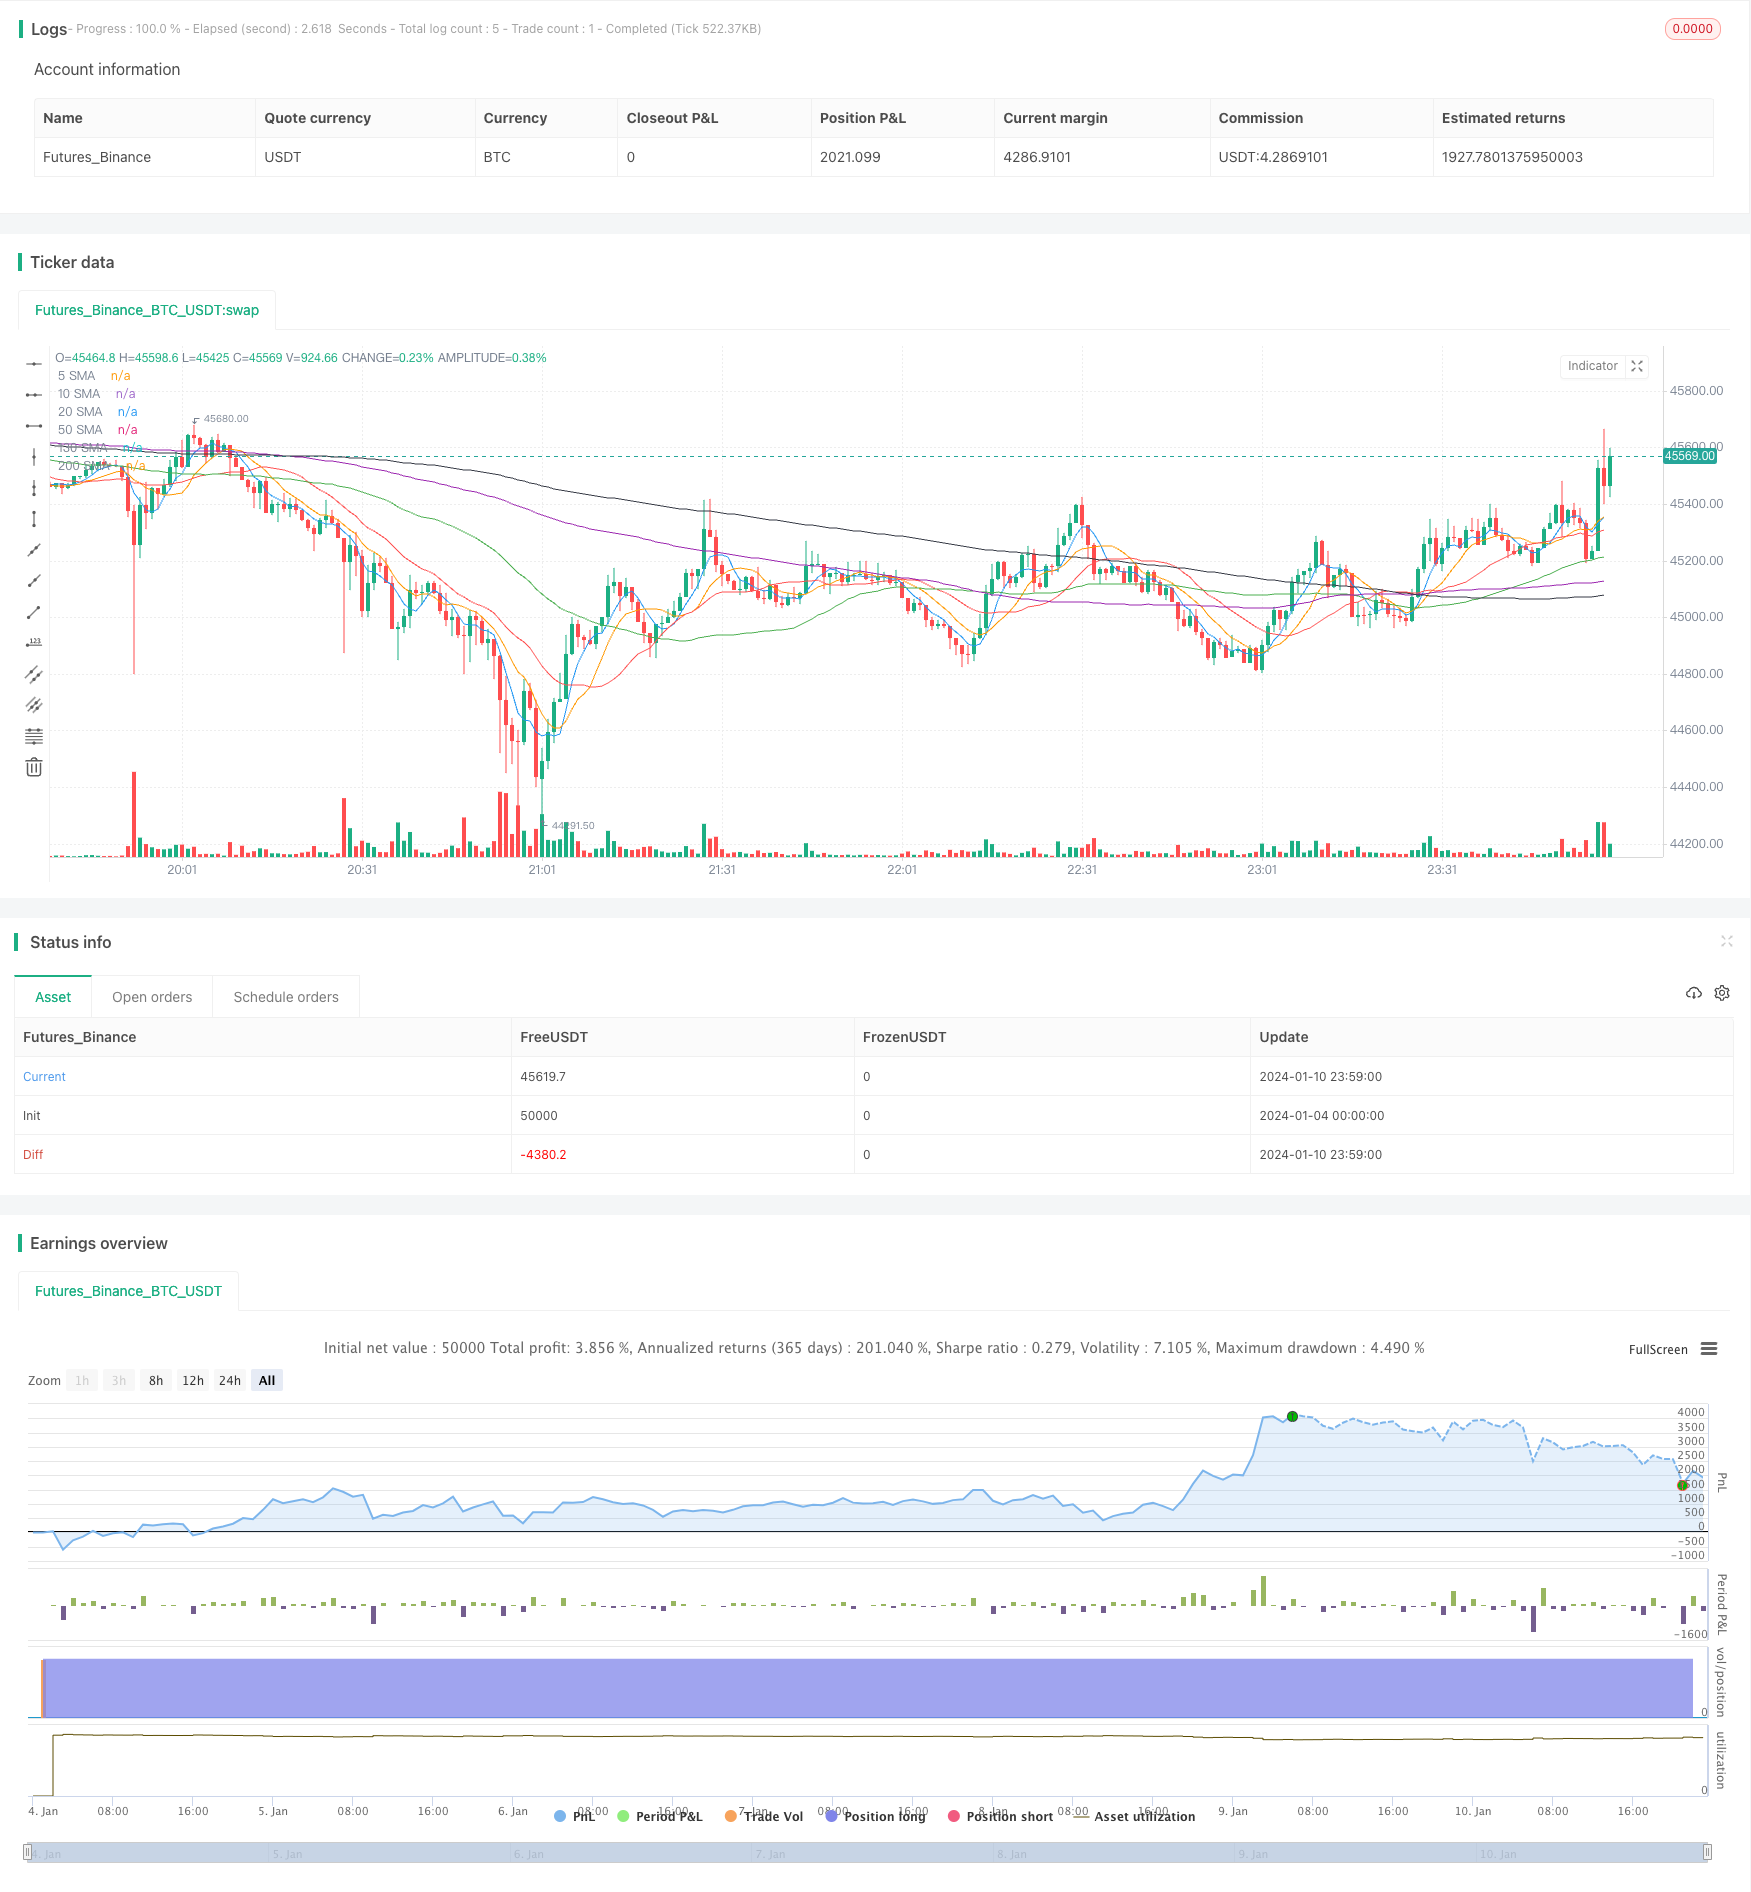
start: 2024-01-04 00:00:00
end: 2024-01-11 00:00:00
period: 1m
basePeriod: 1m
exchanges: [{"eid":"Futures_Binance","currency":"BTC_USDT"}]
*/

//@version=4
strategy("SMA Crossover Strategy", overlay=true)

// Define SMAs
sma5 = sma(close, 5)
sma10 = sma(close, 10)
sma20 = sma(close, 20)
sma50 = sma(close, 50)
sma130 = sma(close, 130)
sma200 = sma(close, 200)

// Plot SMAs on the chart
plot(sma5, color=color.blue, title="5 SMA")
plot(sma10, color=color.orange, title="10 SMA")
plot(sma20, color=color.red, title="20 SMA")
plot(sma50, color=color.green, title="50 SMA")
plot(sma130, color=color.purple, title="130 SMA")
plot(sma200, color=color.black, title="200 SMA")

// Generating the buy and sell signals
buySignal = crossover(sma5, sma200)
sellSignal = crossunder(sma5, sma200)

// Execute trades based on signals
if (buySignal)
    strategy.entry("Buy", strategy.long)

if (sellSignal)
    strategy.close("Sell")


More