概述
本策略基于MACD指标以及长线和平仓线,实现了货币对的长线交易。当MACD指标线穿过长线时进行开仓,当MACD指标线穿过平仓线时进行平仓。同时设置了止损策略。
策略原理
该策略使用MACD指标的快线和慢线。快线参数为12日EMA,慢线参数为26日EMA。两条均线之间差值为MACD柱状图。另外计算9日EMA作为讯号线。当MACD柱状图上穿0.04时做多,下穿0.015时平多单。同时设置了5%的止损。
具体来说,策略首先计算MACD指标的快线、慢线和信号线。然后设置长线为-0.04,平仓线为0.015。如果当前MACD柱状图大于长线,进行做多;如果当前MACD柱状图小于平仓线,进行平多仓。此外,设置止损线为开仓价格的95%。
优势分析
该策略具有以下优势:
- 使用MACD指标判断行情趋势,准确率较高
- 同时使用长线和平仓线双重过滤,避免错误信号
- 设置止损策略,有效控制风险
- 简单明了,逻辑清晰,易于理解与实施
- 仅需和MACD指标,资源占用低
风险分析
该策略也存在一定风险:
- MACD指标具有一定滞后性,可能错过短线机会
- 止损设置可能过于保守,无法持续跟踪长线趋势
- 参数设置需要反复测试优化,否则可能过拟合
- 仅适用于,其他货币对效果存疑
可以通过适当调整参数、组合其他指标等方法来优化和改进。
优化方向
该策略可以从以下几个方面进行优化:
- 测试不同的MACD参数组合,寻找更优参数
可以尝试不同长度的快线、慢线、信号线,找到更合适的组合
- 更换其他指标试探
例如RSI,KD等指标可能带来截然不同的效果
- 优化长线和平仓线参数
可以通过反复回测数据,寻找更合适的长平仓参数
- 调整止损策略
可以考虑trailing stop等方法,让止损更加动态跟踪
- 测试多种货币对
将策略运用到其他货币对,考察效果
总结
本策略overall是一个非常简单直观的长线交易策略。利用MACD指标判断行情,并设置双重过滤条件减少误交易。同时配置了止损来控制风险。该策略逻辑清晰,资源占用低,易于理解和实施,值得推荐。当然,通过参数优化、指标调整等手段,该策略还有很大的改进空间,可以使效果更加出色。
策略源码
/*backtest
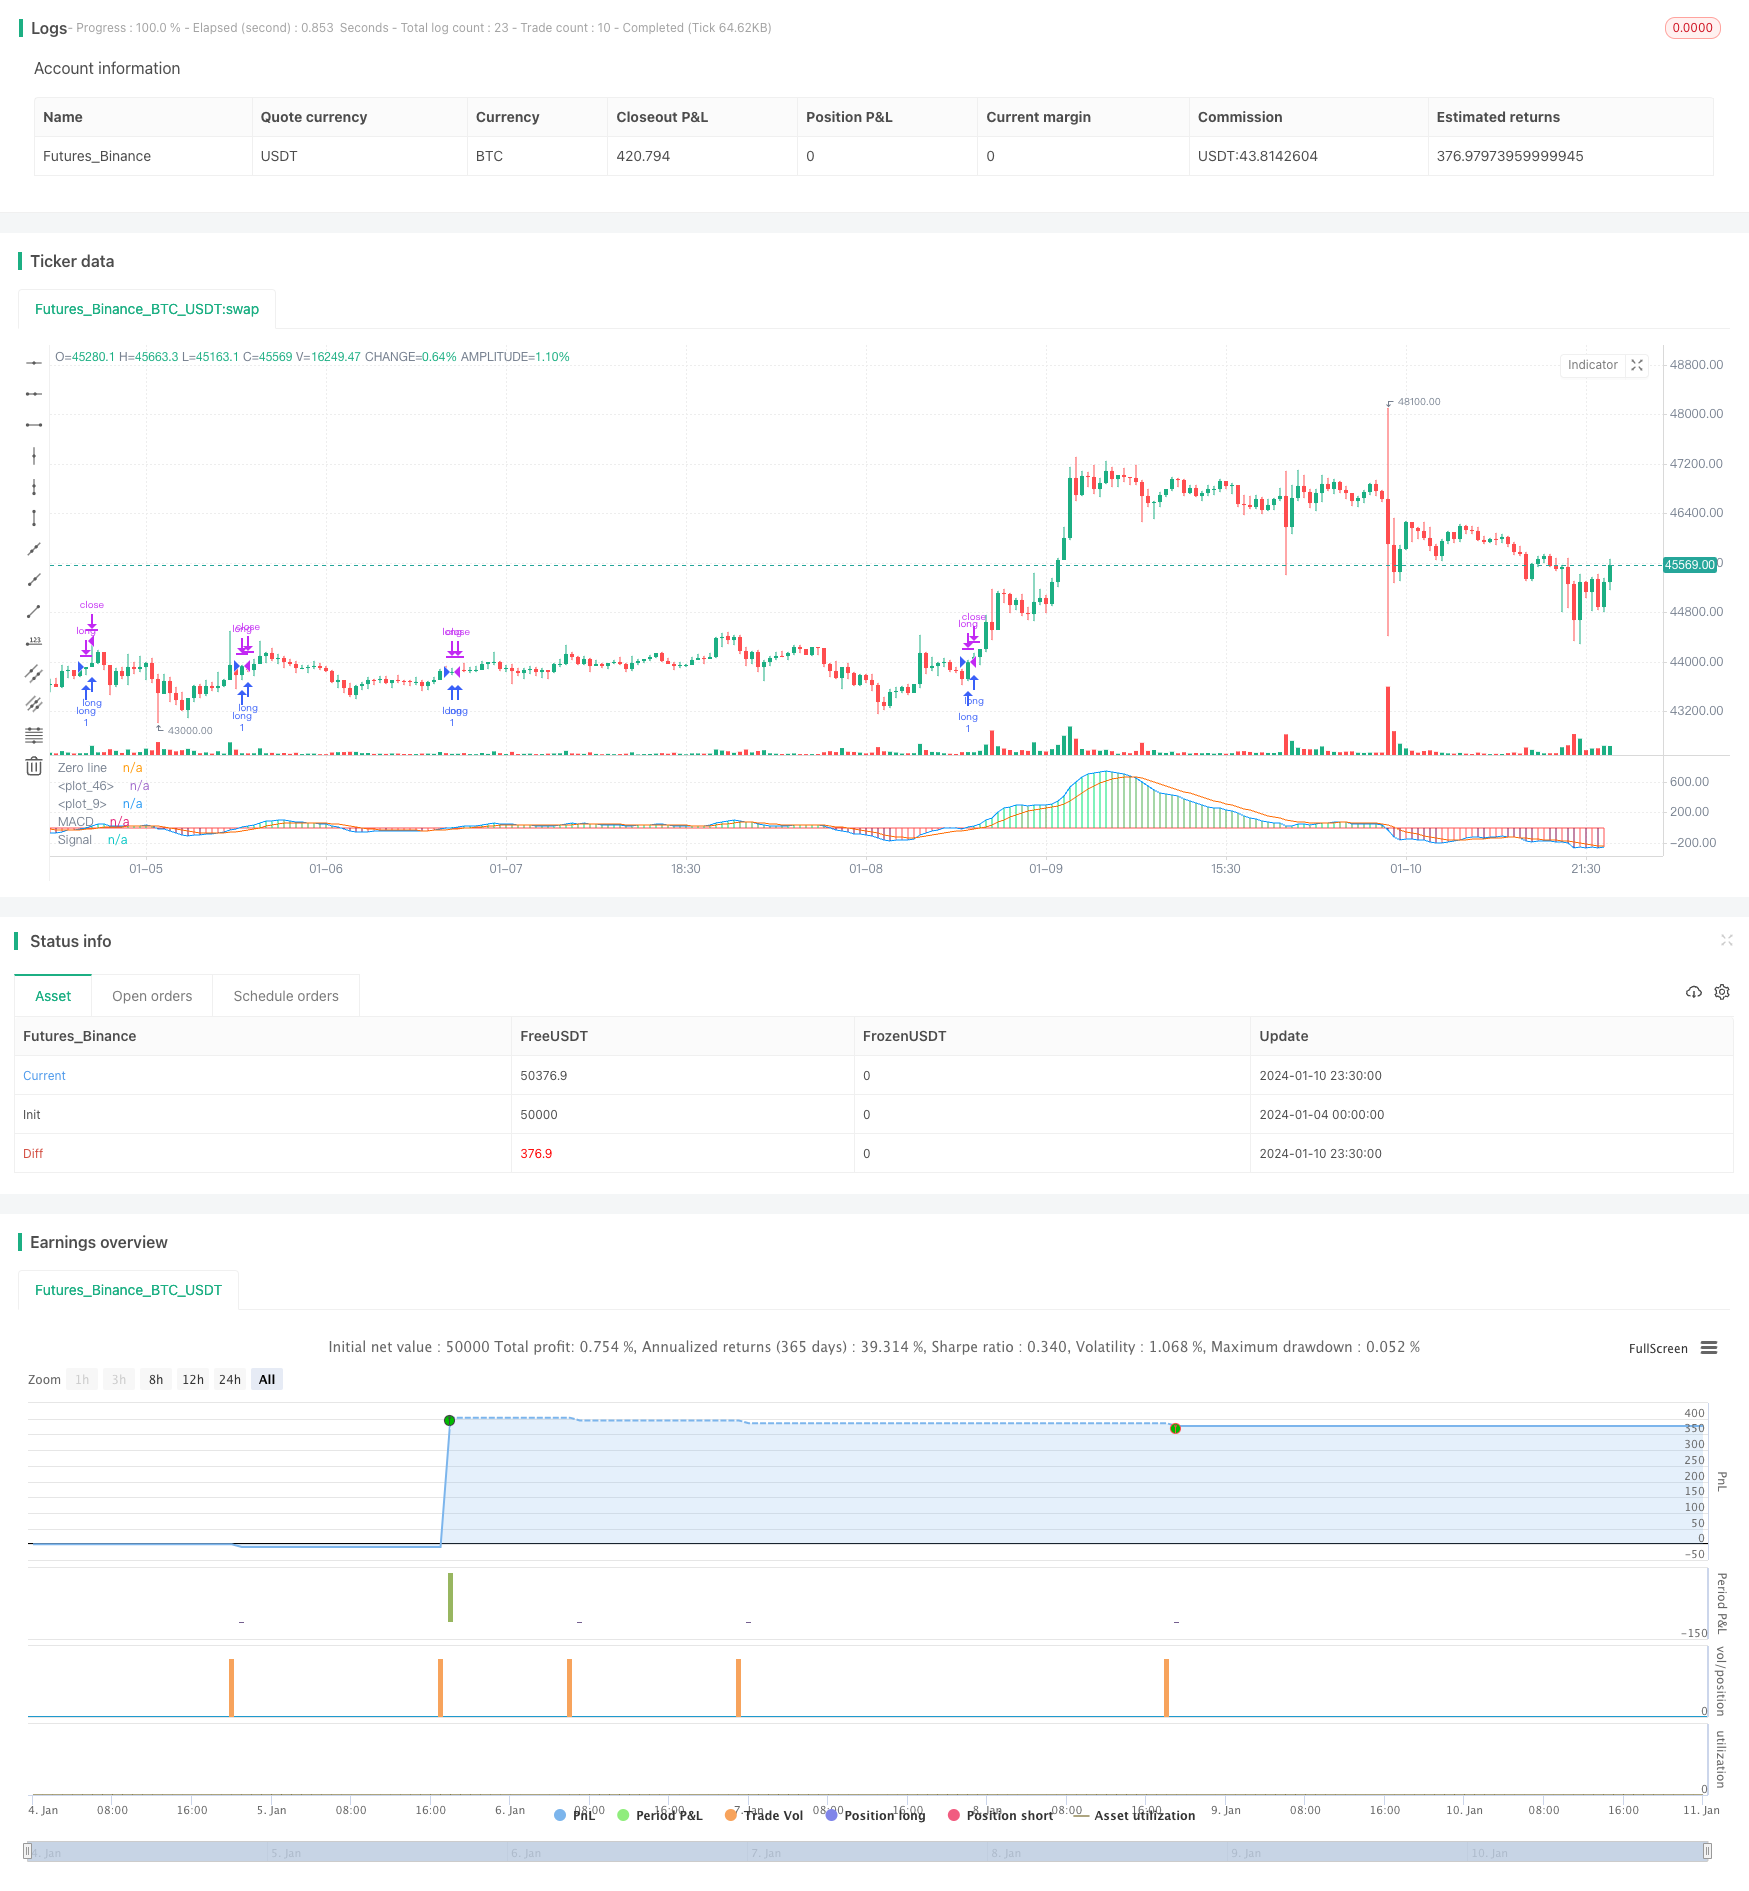
start: 2024-01-04 00:00:00
end: 2024-01-11 00:00:00
period: 30m
basePeriod: 15m
exchanges: [{"eid":"Futures_Binance","currency":"BTC_USDT"}]
*/
//@version=3
strategy(shorttitle = "GBPJPY MACD", title = "GBPJPY MACD")
fastMA = input(title="Fast moving average", defval = 12, minval = 7)
slowMA = input(title="Slow moving average", defval = 26, minval = 7)
lastColor = yellow
[currMacd,_,_] = macd(close[0], fastMA, slowMA, 9)
[prevMacd,_,_] = macd(close[1], fastMA, slowMA, 9)
plotColor = currMacd > 0 ? currMacd > prevMacd ? lime : green : currMacd < prevMacd ? maroon : red
plot(currMacd, style = histogram, color = plotColor, linewidth = 3)
plot(0, title = "Zero line", linewidth = 1, color = gray)
//MACD
// Getting inputs
fast_length = input(title="Fast Length", defval=12)
slow_length = input(title="Slow Length", defval=26)
src = input(title="Source", defval=close)
signal_length = input(title="Signal Smoothing", minval = 1, maxval = 50, defval =9)
sma_source = input(title="Simple MA(Oscillator)", type=bool, defval=false)
sma_signal = input(title="Simple MA(Signal Line)", type=bool, defval=false)
// Plot colors
col_grow_above = #26A69A
col_grow_below = #FFCDD2
col_fall_above = #B2DFDB
col_fall_below = #EF5350
col_macd = #0094ff
col_signal = #ff6a00
// Calculating
fast_ma = sma_source ? sma(src, fast_length) : ema(src, fast_length)
slow_ma = sma_source ? sma(src, slow_length) : ema(src, slow_length)
macd = fast_ma - slow_ma
signal = sma_signal ? sma(macd, signal_length) : ema(macd, signal_length)
hist = macd - signal
//plot(hist, title="Histogram", style=columns, color=(hist>=0 ? (hist[1] < hist ? col_grow_above : col_fall_above) : (hist[1] < hist ? col_grow_below : col_fall_below) ), transp=0 )
plot(macd, title="MACD", color=col_macd, transp=0)
plot(signal, title="Signal", color=col_signal, transp=0)
///END OF MACD
//Long and Close Long Lines
linebuy = input(title="Enter Long", type=float, defval=-0.04)
linesell = input(title="Close Long", type=float, defval=0.015)
//Plot Long and Close Long Lines
plot(linebuy,color=green),plot(linesell,color=red)
//Stop Loss Input
sl_inp = input(0.05, title='Stop Loss %', type=float)/100
//Order Conditions
longCond = crossover(currMacd, linebuy)
exitLong = crossover(currMacd, linesell)
stop_level = strategy.position_avg_price * (1 - sl_inp)
//Order Entries
strategy.entry("long", strategy.long, when=longCond==true)
strategy.close("long", when=exitLong==true)
strategy.exit("Stop Loss", stop=stop_level)