概述
这个策略是基于使用Hull移动平均线(HMA)的1、2、3和4阶时间导数进行投资的。它会等份投入一定的资金。 entry点是通过2、3和4阶导数的趋势识别的,而exit点是在一个新的entry点或追踪止损百分比处创建的。
策略原理
该策略首先计算HMA。Hull移动平均线是一个加权移动平均线,它使用以下公式计算:
hullma = wma(2*wma(src,sm/2)-wma(src,sm),round(sqrt(sm)))
其中src是价格,sm是一个输入参数,控制平均线的长度。
之后,该策略计算速度(1阶导数)、加速度(2阶导数)、震荡(3阶导数)和激荡(4阶导数)。这些是通过计算HMA和其滞后值之间的差值然后除以长度len来计算的。例如,速度计算公式是:
speed = (hullma-hullma[len])/len
其余导数的计算方式类似。
策略通过查看加速度、震荡和激荡的正负来决定入场和出场。如果三个指标都是正的,它会开多单。如果三个指标都是负的,它会开空单。
此外,该策略还会trailing stop loss来锁定利润。 多头头寸会根据一个可调整的输入百分比来设置止损,空头头寸同理。
优势分析
这个策略的一个主要优势是它使用多个导数作为入场和出场信号,这可以过滤掉一些假信号。仅仅依靠速度(1阶导数)来决定入场通常太脆弱,但结合2、3、4阶导数,可以建立一个比较强劲的系统。
另一个优势是这个策略非常灵活。它有多个可调整的参数,包括HMA长度、各种导数的长度、止损百分比等,可以针对不同市场进行优化。
使用可调整的追踪止损也是一个优势。这可以帮助策略在趋势行情中获得更多利润,而在震荡行情中及时退出,限制了最大回撤。
风险分析
该策略主要的风险在于突发事件造成的命中率下降。如果没有相关过滤规则,在重大新闻事件突发后,多个导数可能同时出现错误信号,导致较大亏损。可以设置一些新闻过滤,或者在突发事件后暂停策略一段时间以降低这种风险。
另一个风险是参数容易过拟合。HMA长度、各导数长度等参数都可能影响结果。这需要采用严格的回测方法,在不同市场中评估这些参数的稳健性。同时也要注意追踪止损百分比不宜设置太大,否则可能导致亏损扩大。
优化方向
这个策略可以从以下几个方面进行优化:
增加基于突发事件的过滤机制,在重大新闻事件后暂停交易一段时间,避免错失入场点产生过大亏损
对参数进行多市场回测,确保其稳健性。可以回测不同品种、不同时间段的数据,评估参数设置的稳定性
尝试改进入场逻辑。可以引入机器学习算法自动识别趋势,而不是简单的正负判断
改进止损方式。可以使用波动率止损或机器学习止损代替简单的百分比追踪止损
增加止盈 exit。现有逻辑主要依靠止损,可以额外增加向上追踪止盈或目标利润退出
总结
这个策略是一个多时间尺度的趋势跟踪策略。它使用Hull移动平均线的多个导数作为建仓和平仓信号,采用追踪止损来锁定利润。主要优势有利用多个导数过滤掉假信号,策略参数灵活等。需要注意的风险包括突发事件的影响和参数容易过拟合。该策略可以从增加过滤机制、改进参数稳健性、改进入场退出逻辑等方面进行优化,使其成为一个更加可靠和稳定的自动化交易系统。
/*backtest
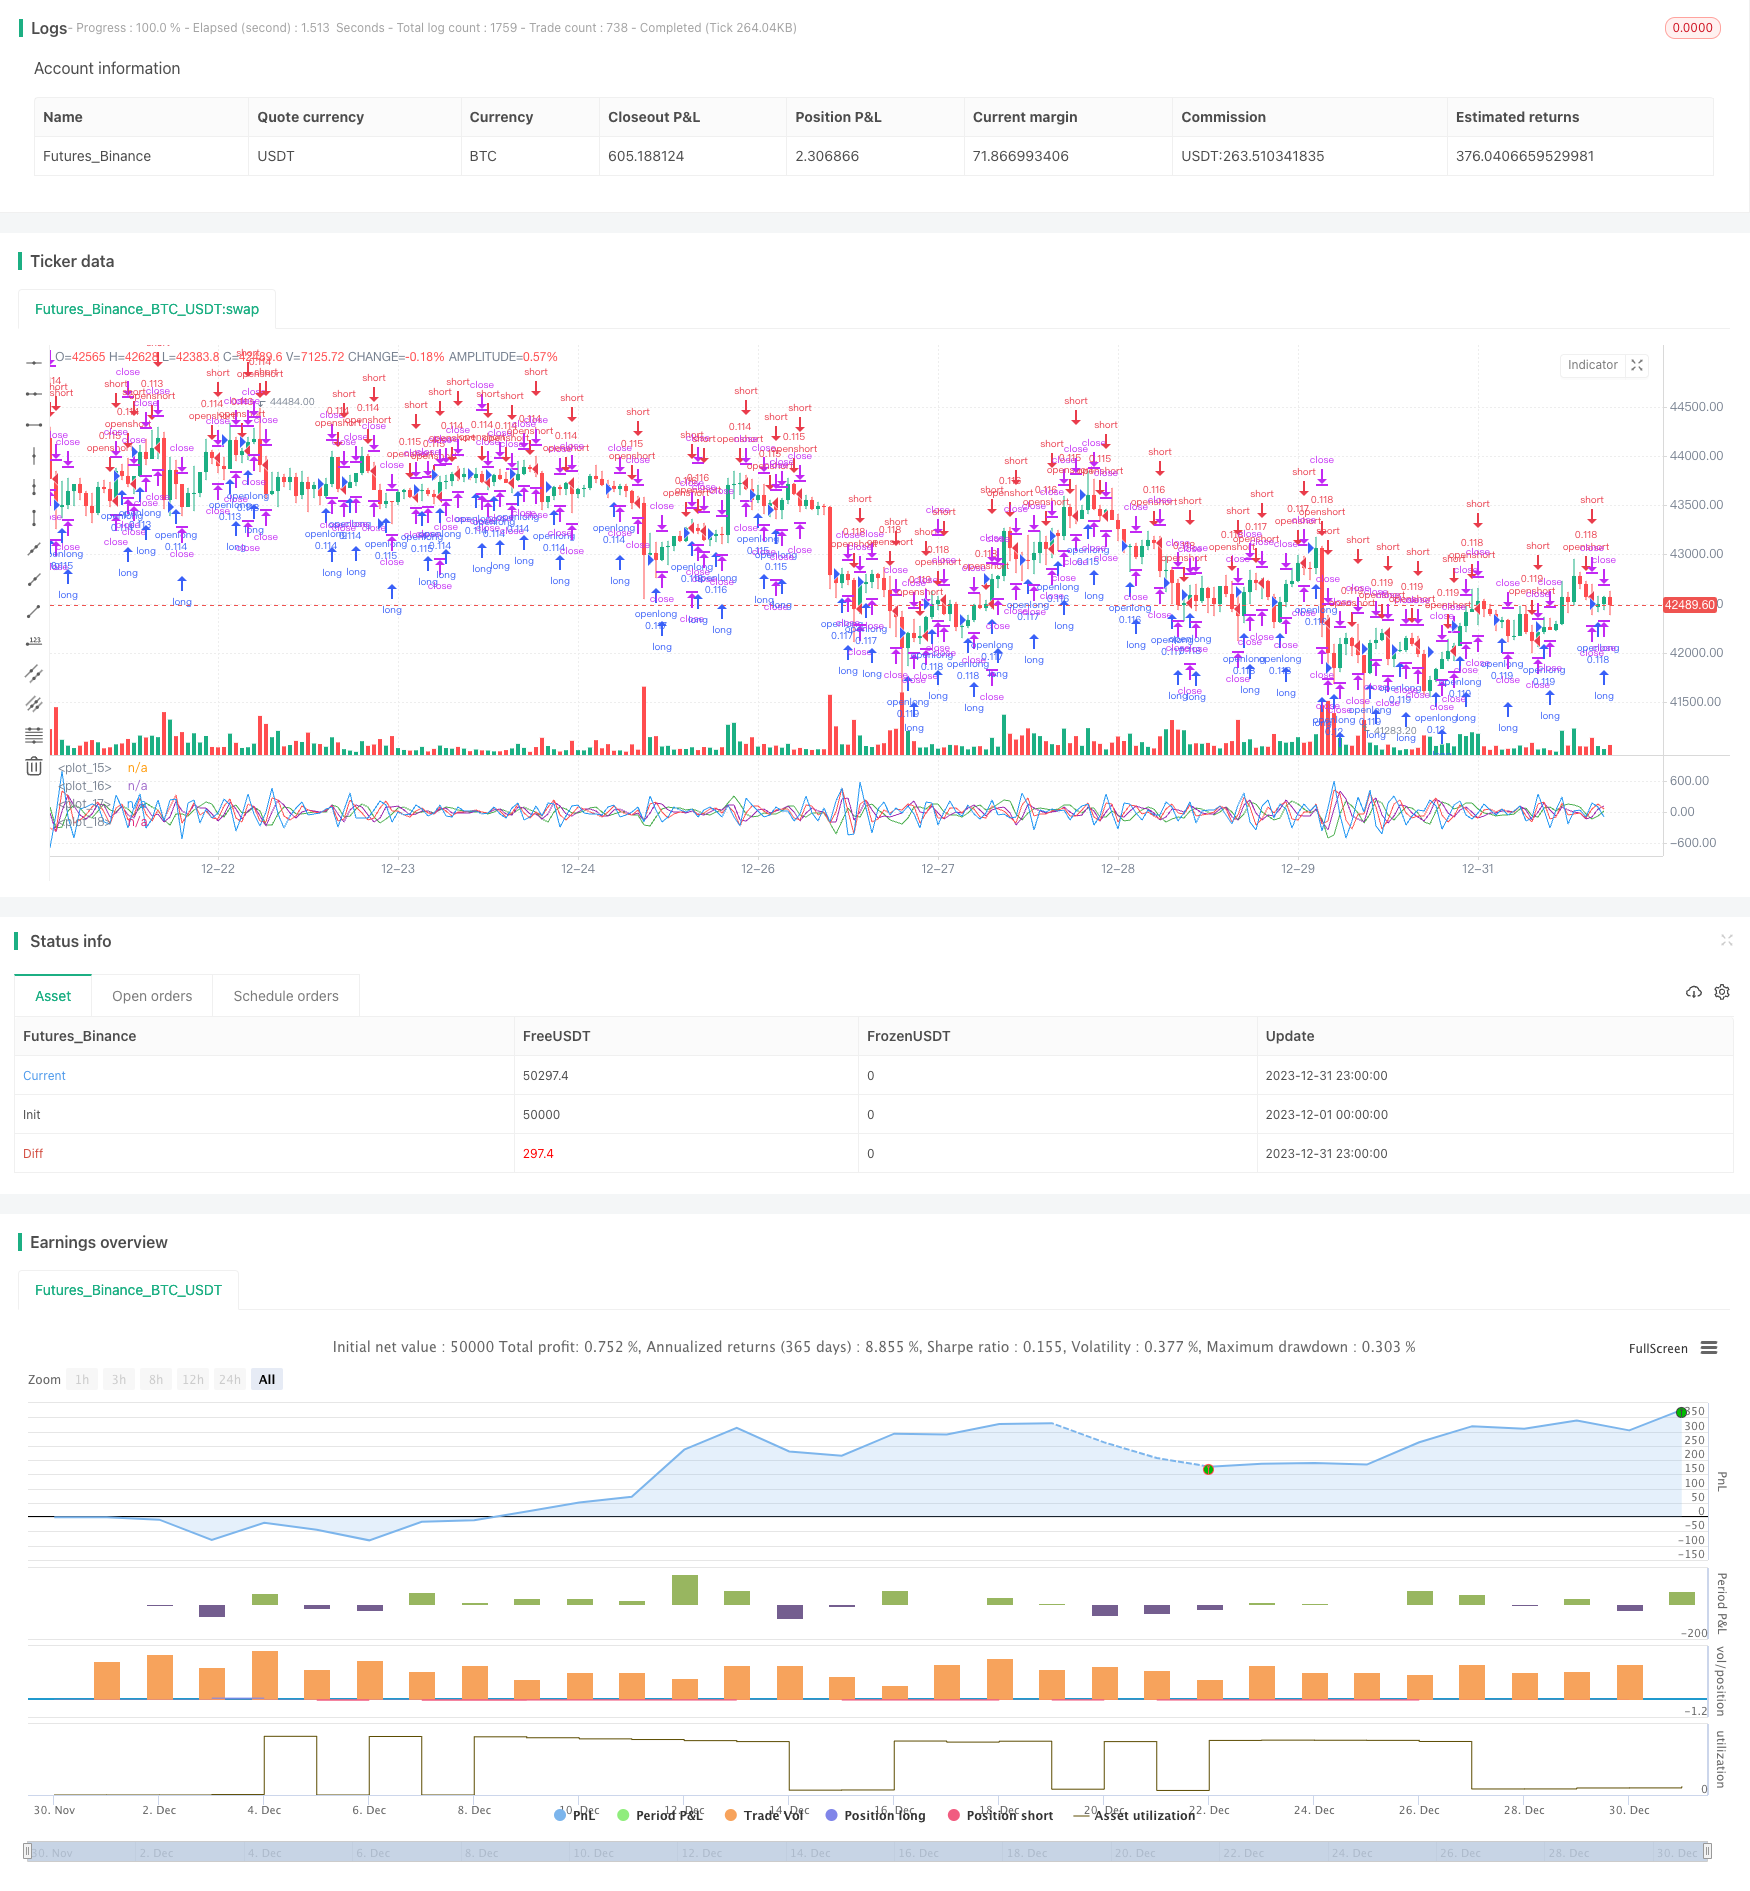
start: 2023-12-01 00:00:00
end: 2023-12-31 23:59:59
period: 1h
basePeriod: 15m
exchanges: [{"eid":"Futures_Binance","currency":"BTC_USDT"}]
*/
//@version=3
strategy(title="Derivative Based Strategy", shorttitle="DER", currency="USD", calc_on_order_fills=true, default_qty_type=strategy.percent_of_equity, default_qty_value=10, initial_capital=1000)
len = input(1, minval=1, title="Derivatives Length")
sm = input(4, minval=1, title="HMA Length")
longTrailPerc=input(title="Trail Long Loss %", type=float,minval=0.0,step=0.1,defval=25)*0.01
shortTrailPerc=input(title="Trail Short Loss %",type=float,minval=0.0,step=0.1,defval=25)*0.01
longStopPrice=0.0
shortStopPrice=0.0
src = input(ohlc4, title="Source")
hullma = wma(2*wma(src,sm/2)-wma(src,sm),round(sqrt(sm)))
speed = (hullma-hullma[len])/len
accel = (speed-speed[len])/len
jerk = (accel-accel[len])/len
jounce = (jerk-jerk[len])/len
plot(speed, color=green)
plot(accel, color=purple)
plot(jerk, color=red)
plot(jounce, color=blue)
// hline(0, linestyle=solid, color=black)
if accel>0 and jerk>0 and jounce>0// and strategy.opentrades==0
strategy.entry("openlong", strategy.long)
if accel<0 and jerk<0 and jounce<0// and strategy.opentrades==0
strategy.entry("openshort",strategy.short)
speed_profit = (strategy.openprofit-strategy.openprofit[1])/len
accel_profit = (speed_profit-speed_profit[1])/len
jerk_profit = (accel_profit-accel_profit[1])/len
longStopPrice:=if(strategy.position_size>0)
stopValue=ohlc4*(1-longTrailPerc)
max(stopValue,longStopPrice[1])
else
0
shortStopPrice:=if(strategy.position_size<0)
stopValue=ohlc4*(1+shortTrailPerc)
min(stopValue,shortStopPrice[1])
else
999999
if(strategy.position_size>0)
strategy.exit(id="closelong",stop=longStopPrice)
if(strategy.position_size<0)
strategy.exit(id="closeshort",stop=shortStopPrice)