概述
该策略通过计算CMO指标和变化率,动态绘制支持线。当价格突破支持线时产生交易信号。同时,策略还通过优化支持线附近的止损范围来锁定更多利润。
策略原理
- 计算CMO指标,用于判断价格趋势
- 计算变化率Var,反映价格变化趋势
- 根据变化率绘制支持线
- 计算优化后的止损线longStop和shortStop
- 当价格突破支持线时产生交易信号
优势分析
- 利用CMO指标判断价格趋势,避免假突破
- 支持线能清晰判断趋势方向
- 优化后的止损线能锁定更多利润
- 交易信号简单清晰,容易跟单
风险分析
- CMO指标存在滞后,可能错过价格转折点
- 支持线被突破可能形成假信号
- 止损范围优化不当可能带来更大亏损
风险解决方法: 1. 适当调整CMO参数,降低滞后 2. 结合其他指标过滤假信号 3. 测试确定适合的止损优化比例
优化方向
- 更多指标结合,过滤假信号
- AI自动优化止损范围
- 自动调整交易量
总结
该策略整体来说效果不错,利用支持线清晰判断趋势方向。同时结合CMO指标和优化止损能获得不错效果。但是存在一定假信号风险,可以通过多指标组合来优化。
策略源码
/*backtest
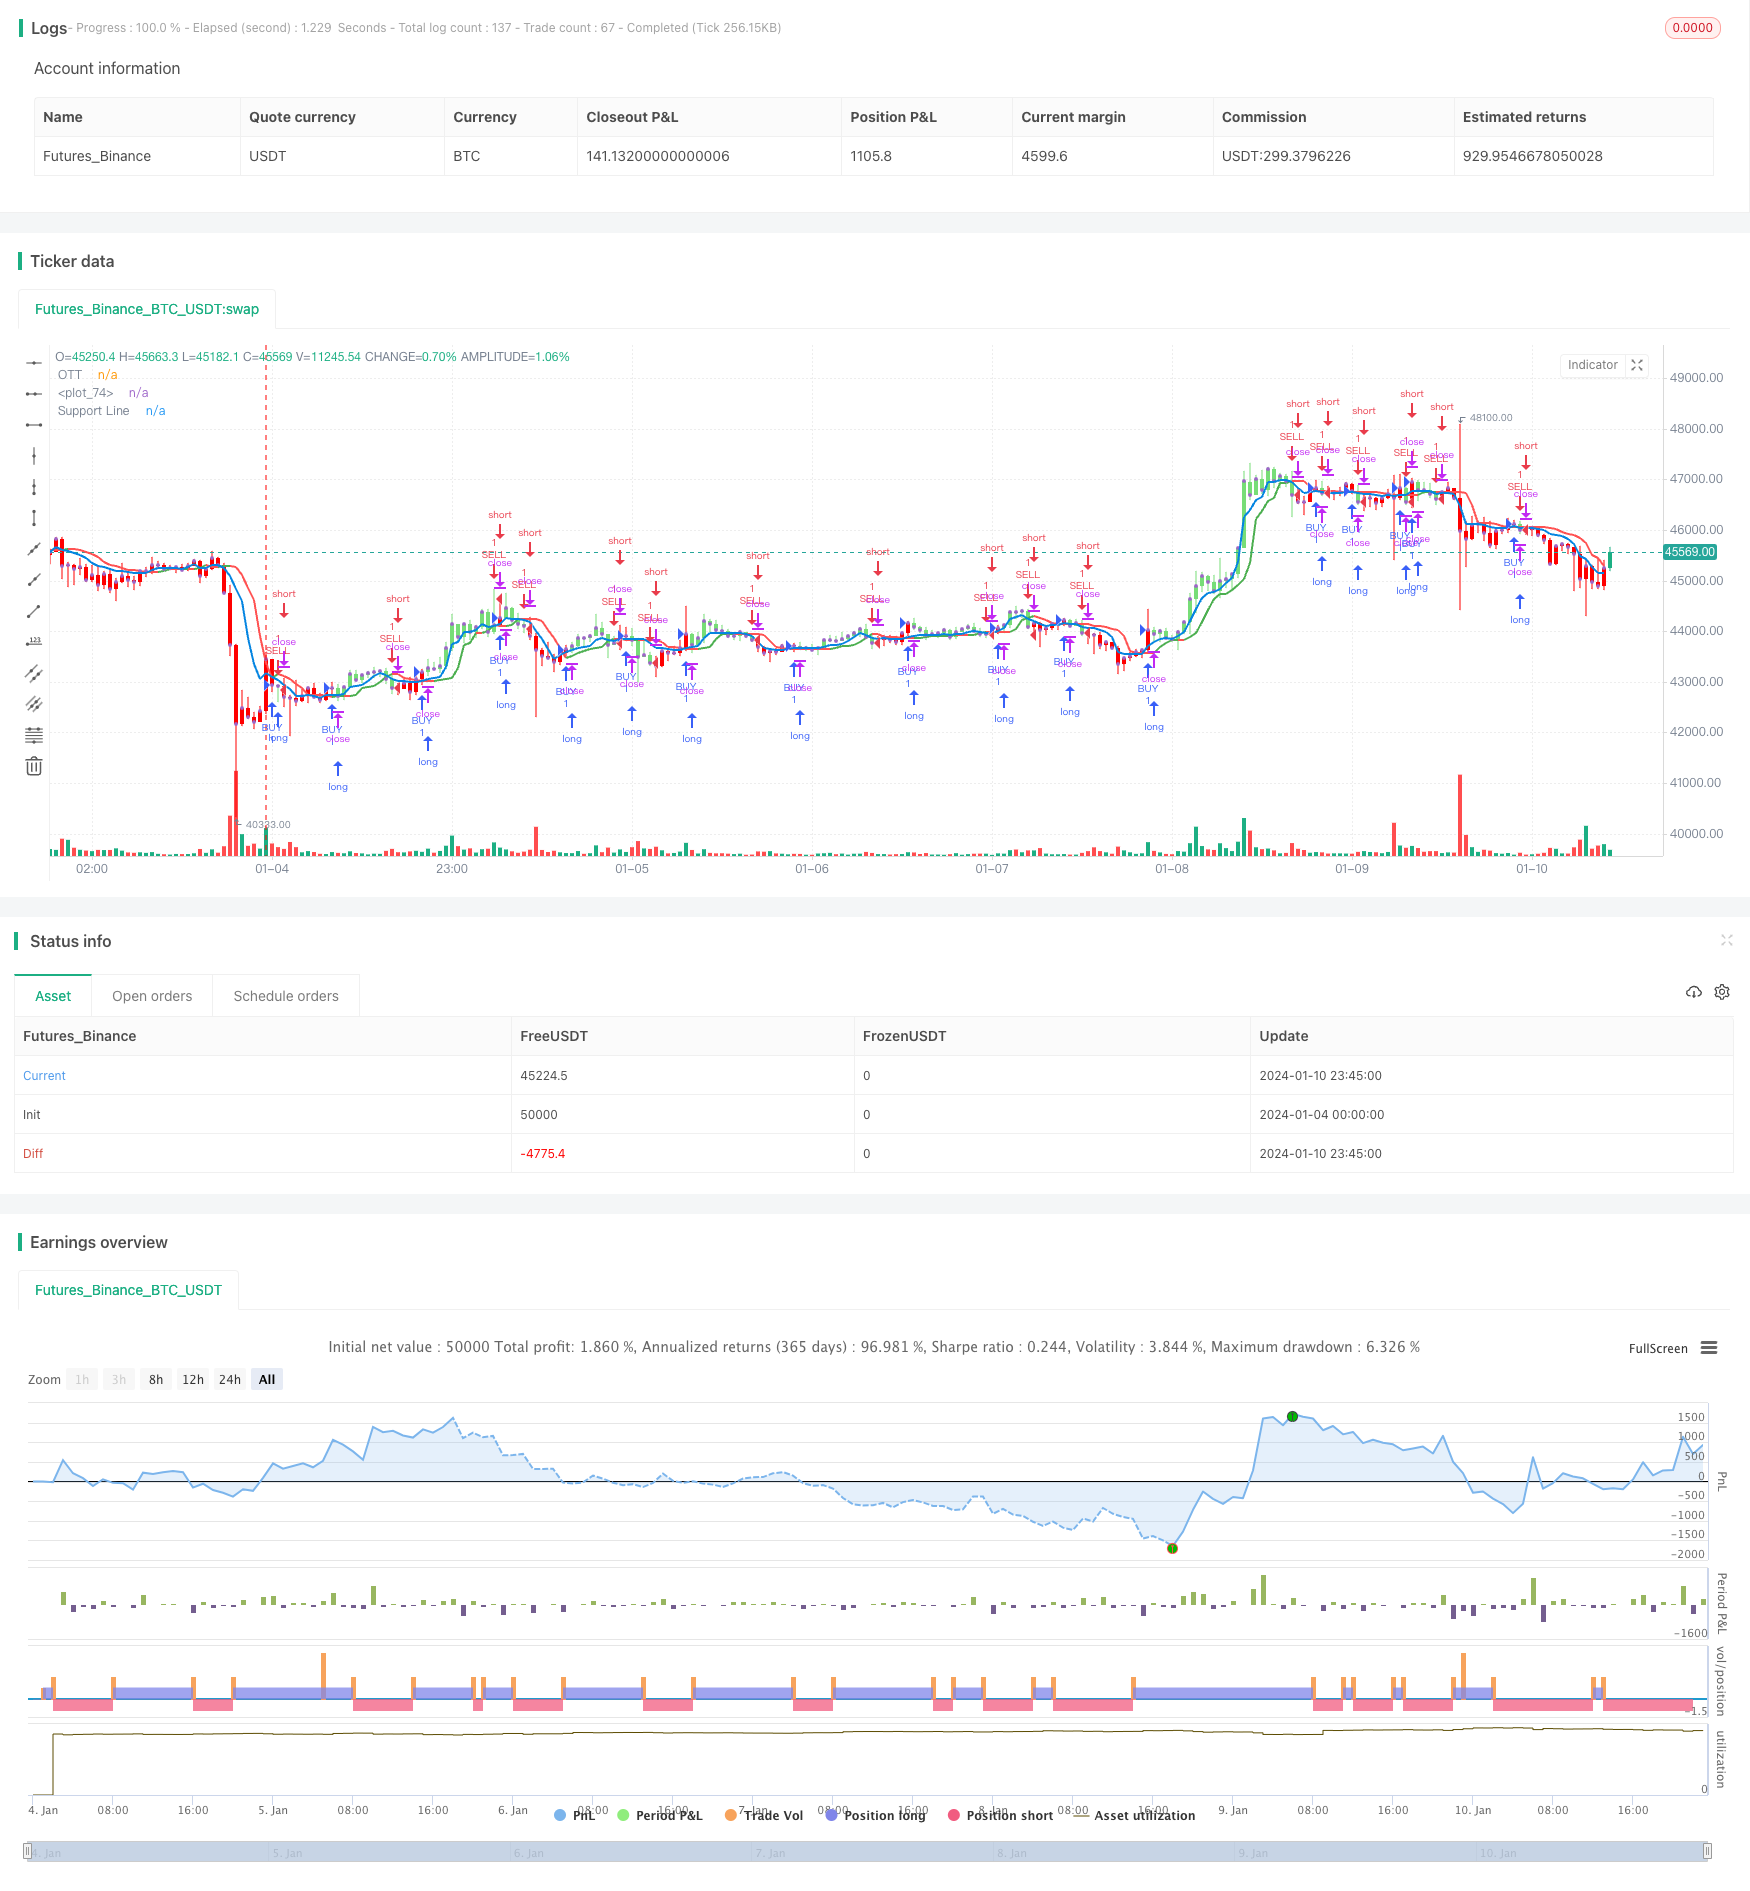
start: 2024-01-04 00:00:00
end: 2024-01-11 00:00:00
period: 45m
basePeriod: 5m
exchanges: [{"eid":"Futures_Binance","currency":"BTC_USDT"}]
*/
// This source code is subject to the terms of the Mozilla Public License 2.0 at https://mozilla.org/MPL/2.0/
// © melihtuna
//@version=4
strategy("Optimized Trend Tracker - Strategy Version", shorttitle="OTT-Strategy", overlay=true, default_qty_type=strategy.percent_of_equity, default_qty_value=100, initial_capital=10000, currency=currency.USD, commission_value=0.1, commission_type=strategy.commission.percent)
src = input(close, title="Source")
pds=input(1, "OTT Period", minval=1)
percent=input(0.1, "OTT Percent", type=input.float, step=0.1, minval=0)
condition = input(title="Condition", defval="Support Line Crossing Signals", options=["Price/OTT Crossing Signals", "Support Line Crossing Signals"])
showsupport = input(title="Show Support Line?", type=input.bool, defval=true)
highlight = input(title="Show OTT Color Changes?", type=input.bool, defval=true)
highlighting = input(title="Highlighter On/Off ?", type=input.bool, defval=true)
barcoloing = input(title="Barcolor On/Off ?", type=input.bool, defval=true)
showlabels = input(title="Show OTT BUY/SELl Labels?", type=input.bool, defval=false)
// === INPUT BACKTEST RANGE ===
FromMonth = input(defval = 1, title = "From Month", minval = 1, maxval = 12)
FromDay = input(defval = 1, title = "From Day", minval = 1, maxval = 31)
FromYear = input(defval = 2020, title = "From Year", minval = 2017)
ToMonth = input(defval = 1, title = "To Month", minval = 1, maxval = 12)
ToDay = input(defval = 1, title = "To Day", minval = 1, maxval = 31)
ToYear = input(defval = 9999, title = "To Year", minval = 2017)
// === FUNCTION EXAMPLE ===
start = timestamp(FromYear, FromMonth, FromDay, 00, 00) // backtest start window
finish = timestamp(ToYear, ToMonth, ToDay, 23, 59) // backtest finish window
window() => time >= start and time <= finish ? true : false // create function "within window of time"
alpha=2/(pds+1)
ud1=src>src[1] ? src-src[1] : src
dd1=src<src[1] ? src[1]-src : src
UD=sum(ud1,9)
DD=sum(dd1,9)
CMO=(UD-DD)/(UD+DD)
k= abs(CMO)
Var=0.0
Var:=(alpha*k*src)+(1-alpha*k)*nz(Var[1])
fark=Var*percent*0.01
longStop = Var - fark
longStopPrev = nz(longStop[1], longStop)
longStop := Var > longStopPrev ? max(longStop, longStopPrev) : longStop
shortStop = Var + fark
shortStopPrev = nz(shortStop[1], shortStop)
shortStop := Var < shortStopPrev ? min(shortStop, shortStopPrev) : shortStop
dir = 1
dir := nz(dir[1], dir)
dir := dir == -1 and Var > shortStopPrev ? 1 : dir == 1 and Var < longStopPrev ? -1 : dir
MT = dir==1 ? longStop: shortStop
OTT=Var>MT ? MT*(200+percent)/200 : MT*(200-percent)/200
plot(showsupport ? Var : na, color=#0585E1, linewidth=2, title="Support Line")
OTTC = highlight ? OTT[2] > OTT[3] ? color.green : color.red : #B800D9
pALL=plot(nz(OTT[2]), color=OTTC, linewidth=2, title="OTT", transp=0)
buySignalk = window() and crossover(Var, OTT[2])
sellSignallk = window() and crossunder(Var, OTT[2])
buySignalc = window() and crossover(src, OTT[2])
sellSignallc = window() and crossunder(src, OTT[2])
plotshape(condition == "Support Line Crossing Signals" ? showlabels and buySignalk ? OTT*0.995 : na : showlabels and buySignalc ? OTT*0.995 : na, title="BUY", text="BUY", location=location.belowbar, style=shape.labelup, size=size.tiny, color=#0F18BF, textcolor=color.white, transp=0)
plotshape(condition == "Support Line Crossing Signals" ? showlabels and sellSignallk ? OTT*1.005 : na : showlabels and sellSignallc ? OTT*1.005 : na, title="SELL", text="SELL", location=location.abovebar, style=shape.labeldown, size=size.tiny, color=#0F18BF, textcolor=color.white, transp=0)
ottBuyColor=#77DD77
ottSellColor=#FF0000
vColor = strategy.position_size > 0 ? ottBuyColor : ottSellColor
if condition == "Support Line Crossing Signals"
strategy.entry("BUY", true, 1, when = buySignalk)
strategy.entry("SELL", false, 1, when = sellSignallk)
else
strategy.entry("BUY", true, 1, when = buySignalc)
strategy.entry("SELL", false, 1, when = sellSignallc)
mPlot = plot(close, title="", style=plot.style_circles, linewidth=0,display=display.none)
longFillColor = highlighting ? (Var>OTT ? color.green : na) : na
shortFillColor = highlighting ? (Var<OTT ? color.red : na) : na
fill(mPlot, pALL, title="UpTrend Highligter", color=longFillColor)
fill(mPlot, pALL, title="DownTrend Highligter", color=shortFillColor)
barcolor(barcoloing ? vColor : na)