概述
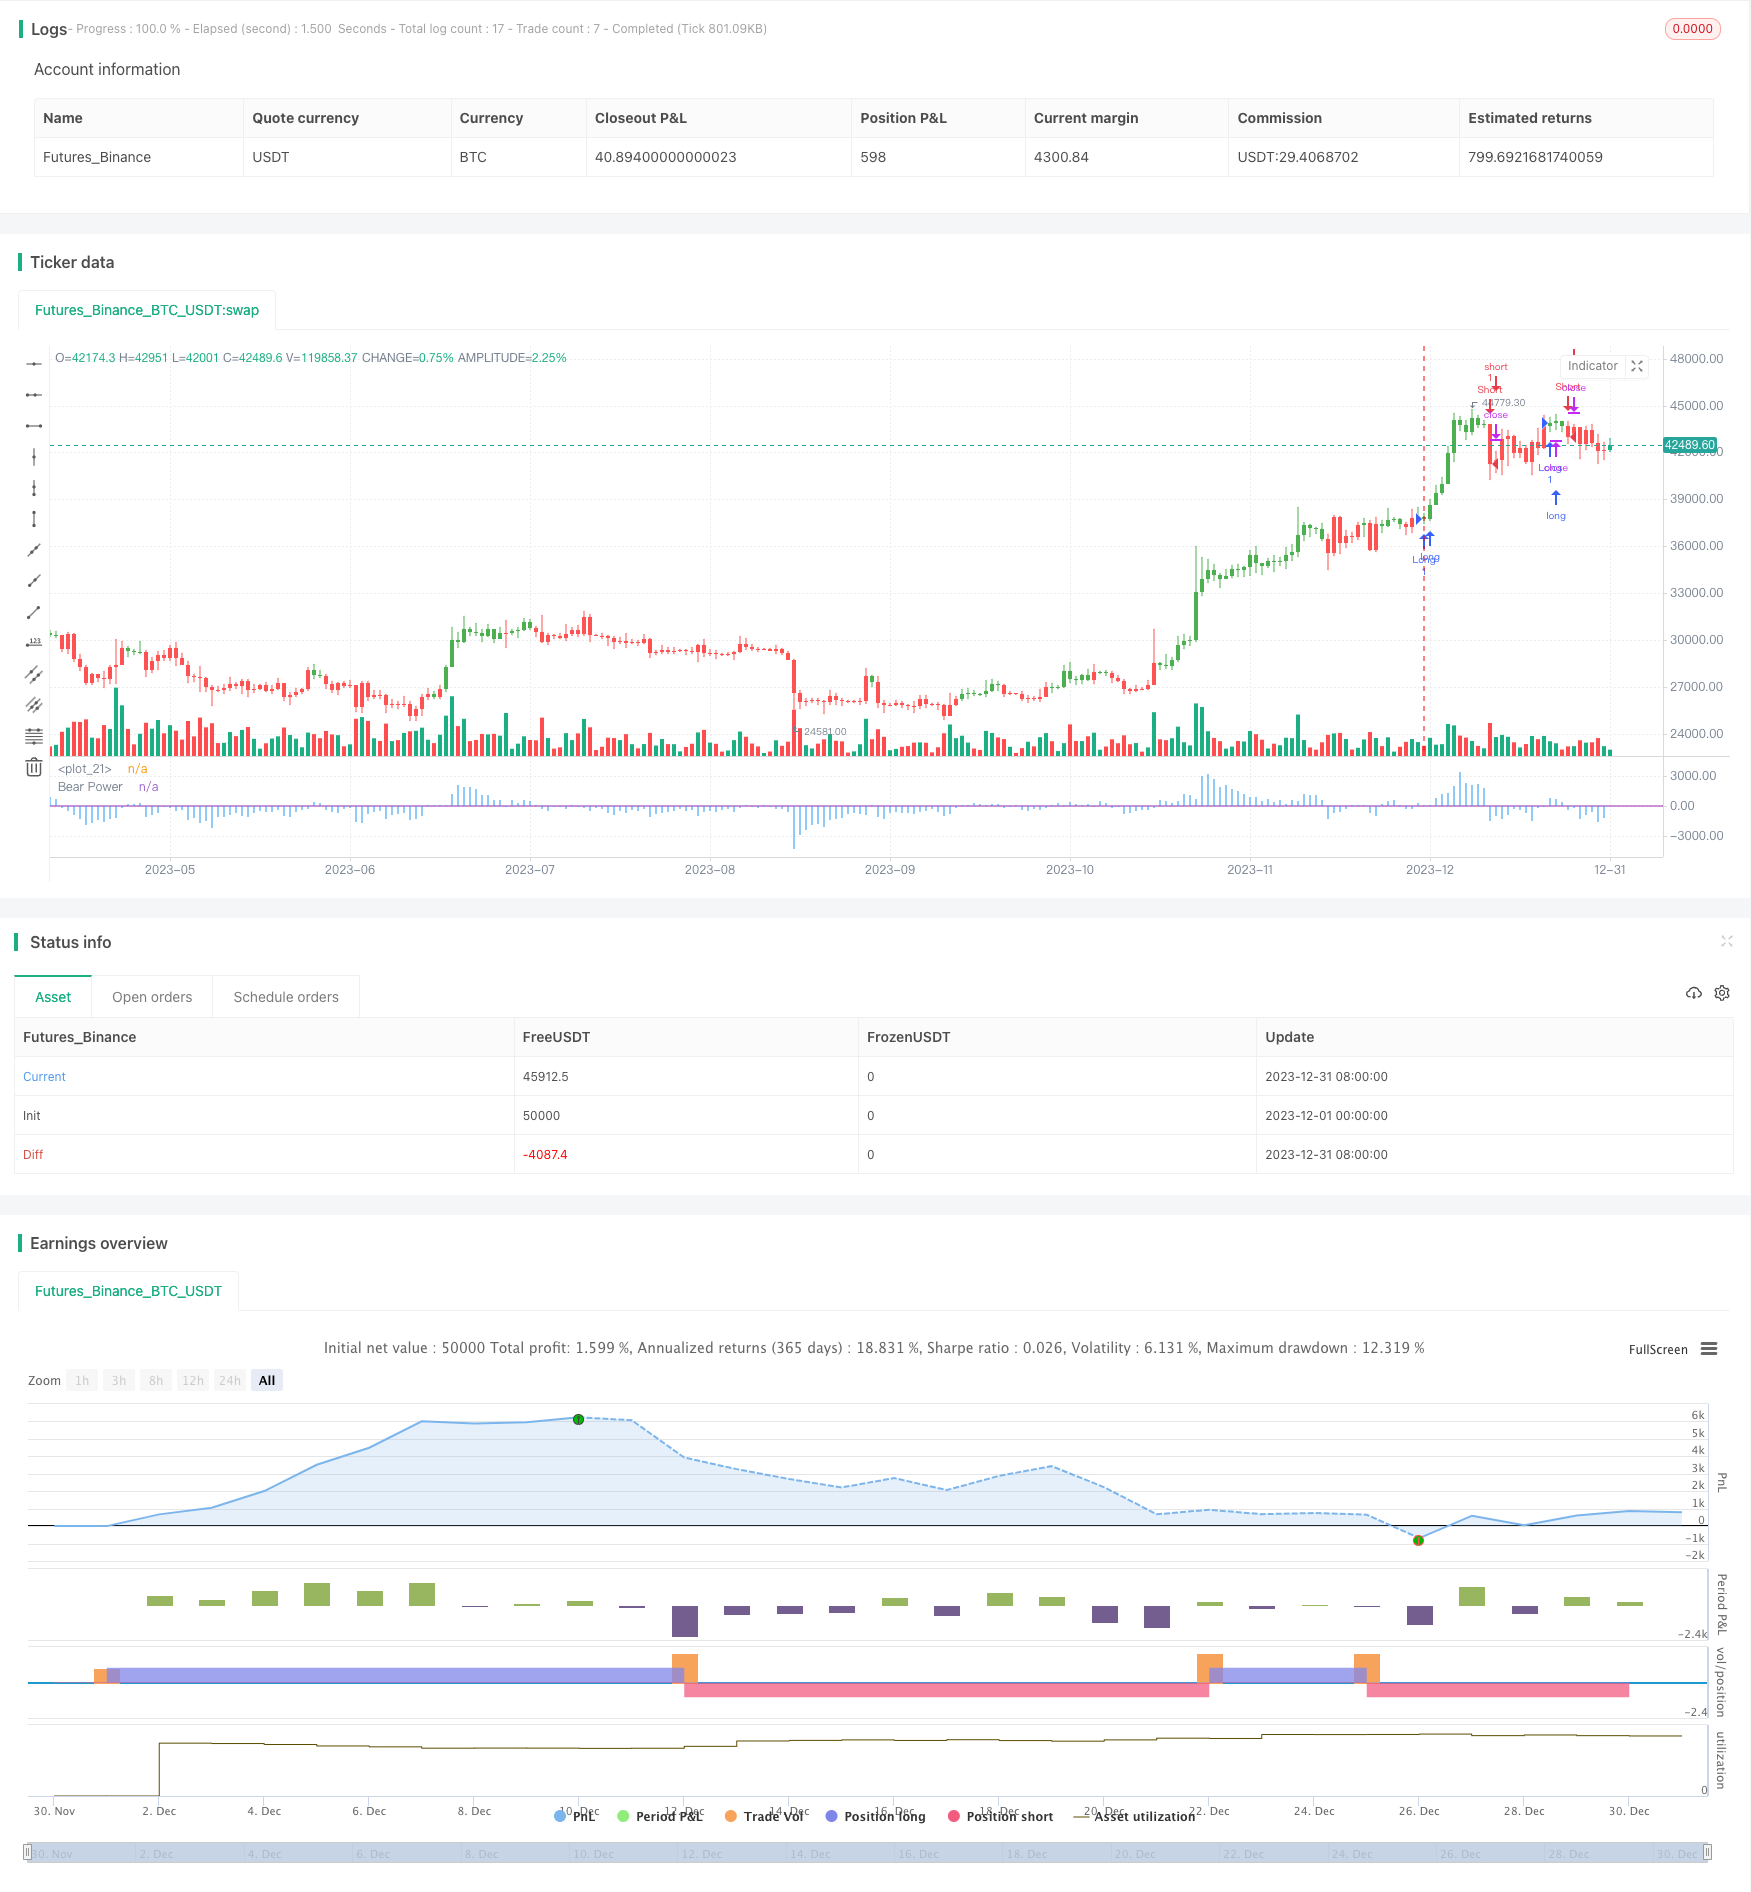
承压指标追踪策略是根据Alexander Elder博士的Elder Ray指标设计的,用于测量市场的买入和卖出压力。该策略采用13日指数移动平均线来表示市场价值的共识,使用承压指标来测量卖方将价格推低共识价值的能力。
策略原理
该策略的核心指标是承压指标,它由当日最低价减去13日指数移动平均线计算得到。当承压指标上穿指定阈值时做多,下穿时做空。它反映了卖方将价格压低平均共识价值的能力。
另外,多空方向还可以通过“交易反转”参数切换。该参数为布尔类型,默认为False。当其为True时,信号发出时做反向操作。
该策略简单实用,通过一个指标判断多空方向,容易实现。
优势分析
该策略具有以下优势:
- 使用单一指标,实现简单,容易理解和应用
- 可灵活调整参数,适用于不同市场环境
- 可选择反转交易,丰富策略类型
风险分析
该策略也存在一些风险:
- 单一指标容易产生假信号
- 未考虑止损,可能造成较大损失
- 参数不当可能导致过于频繁交易
可通过多指标确认,设置止损,调整参数等方式进一步优化。
优化方向
该策略可优化的几个方向:
- 增加其他指标过滤信号,如MACD,KDJ等,避免假突破
- 加入移动止损来限制亏损
- 优化指标参数,调整入场退出点
- 可以考虑结合股票基本面选股
- 可以和其他策略组合使用
总结
承压指标追踪策略概念简单,通过比较单一指标和指定阈值来判断 entrada 和 salida,容易操作。但作为基于指标的策略,可优化空间还很大,可从指标、止损、股票筛选等方面进行综合优化,使策略更稳定可靠。
策略源码
/*backtest
start: 2023-12-01 00:00:00
end: 2023-12-31 23:59:59
period: 1d
basePeriod: 1h
exchanges: [{"eid":"Futures_Binance","currency":"BTC_USDT"}]
*/

//@version = 2
////////////////////////////////////////////////////////////
//  Copyright by HPotter v1.0 07/12/2016
// Developed by Dr Alexander Elder, the Elder-ray indicator measures buying
// and selling pressure in the market. The Elder-ray is often used as part
// of the Triple Screen trading system but may also be used on its own.
// Dr Elder uses a 13-day exponential moving average (EMA) to indicate the
// market consensus of value. Bear Power measures the ability of sellers to
// drive prices below the consensus of value. Bear Power reflects the ability
// of sellers to drive prices below the average consensus of value.
// Bull Power is calculated by subtracting the 13-day EMA from the day's High.
// Bear power subtracts the 13-day EMA from the day's Low.
// You can use in the xPrice any series: Open, High, Low, Close, HL2, HLC3, OHLC4 and ect...
// You can change long to short in the Input Settings
// Please, use it only for learning or paper trading. Do not for real trading.
////////////////////////////////////////////////////////////
strategy(title="Elder Ray (Bear Power) Strategy Backtest")
Length = input(13, minval=1)
Trigger = input(0)
reverse = input(false, title="Trade reverse")
hline(0, color=purple, linestyle=line)
xPrice = close
xMA = ema(xPrice,Length)
DayLow = iff(dayofmonth != dayofmonth[1], low, min(low, nz(DayLow[1])))
nRes = DayLow - xMA
pos = iff(nRes > Trigger, 1,
	   iff(nRes < Trigger, -1, nz(pos[1], 0)))
possig = iff(reverse and pos == 1, -1,
         iff(reverse and pos == -1, 1, pos))
if (possig == 1)
    strategy.entry("Long", strategy.long)
if (possig == -1)
    strategy.entry("Short", strategy.short)
barcolor(possig == -1 ? red: possig == 1 ? green : blue )
plot(nRes, color=blue, title="Bear Power", style = histogram)