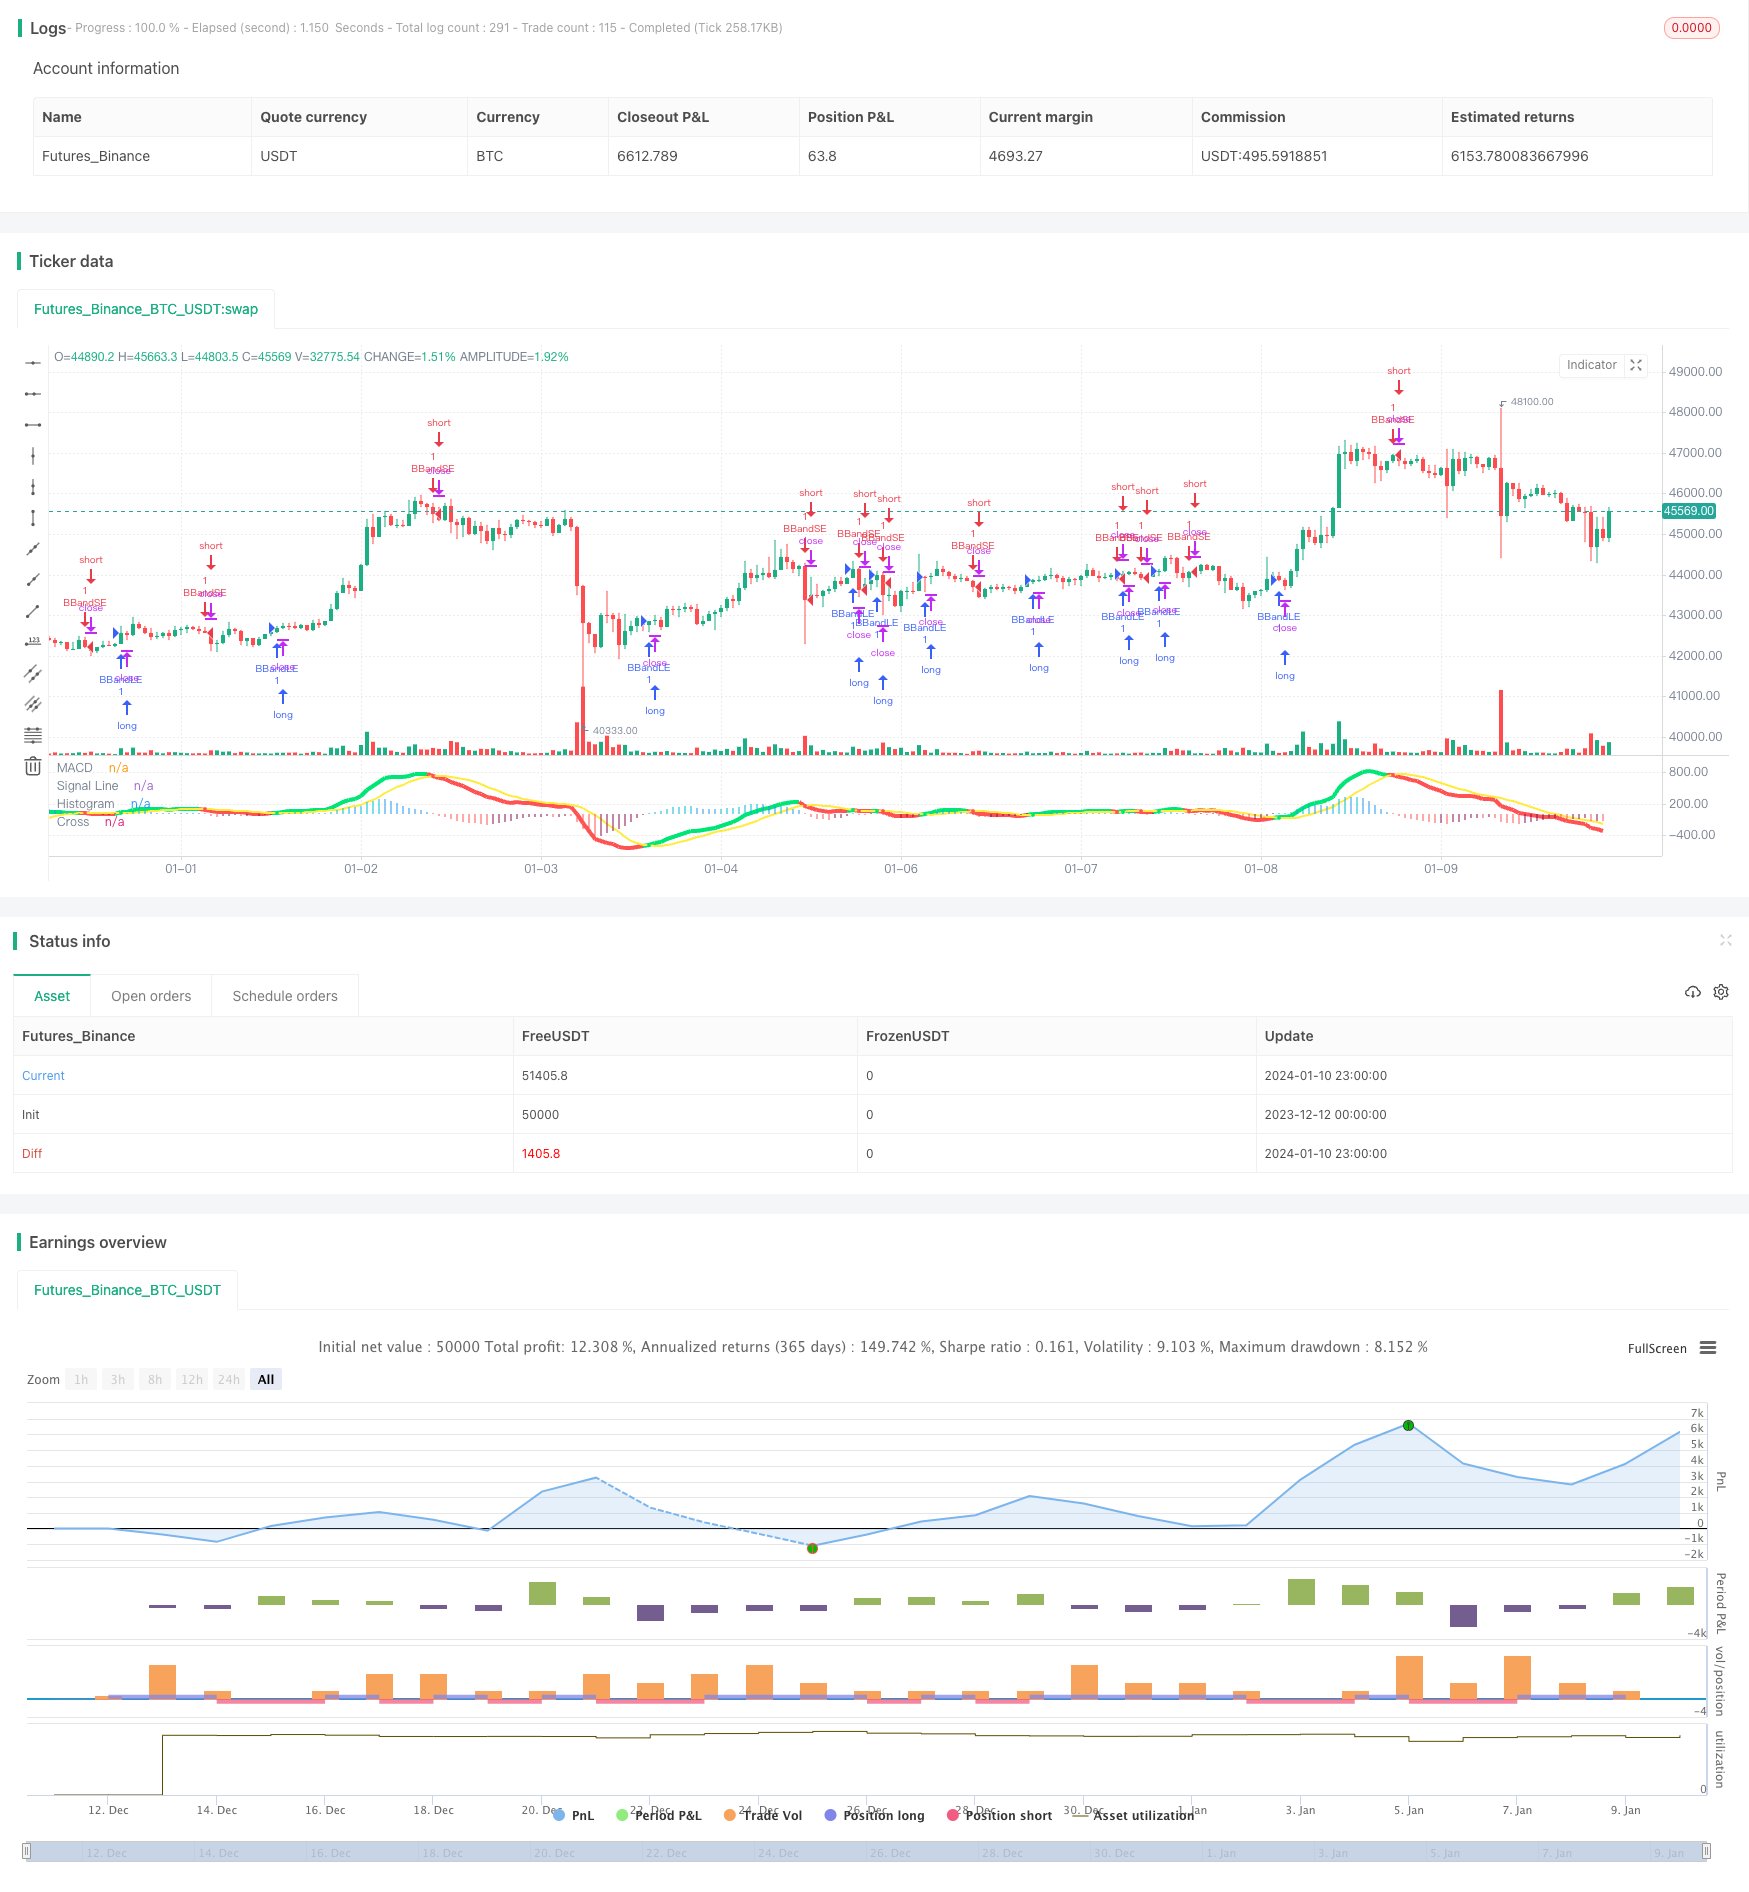
概述:该策略利用MACD指标在多个时间框架上生成交易信号,实现趋势跟踪。其基本思路是在高周期时间框架确认趋势方向,然后在低周期时间框架寻找具体的入场时机。
策略原理: 该策略使用MACD指标的差离线和信号线的交叉来判断趋势方向。具体而言,它在高周期时间框架(默认60分钟)计算MACD差离线和信号线。当差离线上穿信号线时产生买入信号,下穿信号线时产生卖出信号,用于确认总体趋势方向。
然后策略会在低周期时间框架(当前周期)对MACD进行计算,当差离线和信号线发生交叉时,进入相应的仓位。所以高周期用于判断趋势方向,低周期用于寻找具体的入场点位。
该策略还使用柱状图的颜色变化来辅助判断趋势,绿色柱表示正在上涨,红色柱表示正在下跌。
优势分析: 1. 多时框架设计,高周期确定趋势方向,低周期寻找入场点位,系统性好。
利用MACD指标的交叉来判断买卖时机,指标参数经过优化,信号比较可靠。
柱状图颜色辅助判断目前趋势状态,形成多重验证,提高决策的准确性。
自动追踪趋势运行,无需过多人工干预,减少情绪化判断错误。
风险分析: 1. MACD作为跟踪中长期趋势的指标,在短期内可能产生错误信号导致不必要的损失。
多时框架策略由于需要同时考量多个周期,参数优化和测试难度较大。
策略没有设置止损,可能带来较大亏损。
优化方向: 1. 优化MACD的参数,寻找最佳的参数组合。
增加止损机制,限制最大损失。
评估是否需要加入其它指标进行信号过滤,提高信号质量。
测试不同的时框架组合,找到最优时框架匹配。
总结: 本策略整体设计系统性好,同时结合MACD指标的多重优点,能够有效跟踪中长线趋势。但由于未设置止损,难以避免短期损失扩大的风险,这是需要进一步优化的方向。总的来说,该策略以其较强的趋势跟踪能力,为量化交易提供了一个高质量的选股和决策框架。通过不断优化参数和模型,有望进一步扩大获利空间,提高策略的稳定性。
/*backtest
start: 2023-12-12 00:00:00
end: 2024-01-11 00:00:00
period: 1h
basePeriod: 15m
exchanges: [{"eid":"Futures_Binance","currency":"BTC_USDT"}]
*/

//@author : SudeepBisht
//@version=2
strategy(title="SB_CM_MacD_Ult_MTF", shorttitle="SB_CM_Ult_MacD_MTF")
source = close
useCurrentRes = input(true, title="Use Current Chart Resolution?")
resCustom = input(title="Use Different Timeframe? Uncheck Box Above",  defval="60")
smd = input(true, title="Show MacD & Signal Line? Also Turn Off Dots Below")
sd = input(true, title="Show Dots When MacD Crosses Signal Line?")
sh = input(true, title="Show Histogram?")
macd_colorChange = input(true,title="Change MacD Line Color-Signal Line Cross?")
hist_colorChange = input(true,title="MacD Histogram 4 Colors?")

res = useCurrentRes ? timeframe.period : resCustom

fastLength = input(12, minval=1), slowLength=input(26,minval=1)
signalLength=input(9,minval=1)

fastMA = ema(source, fastLength)
slowMA = ema(source, slowLength)

macd = fastMA - slowMA
signal = sma(macd, signalLength)
hist = macd - signal

outMacD = request.security(syminfo.tickerid, res, macd)
outSignal = request.security(syminfo.tickerid, res, signal)
outHist = request.security(syminfo.tickerid, res, hist)

histA_IsUp = outHist > outHist[1] and outHist > 0
histA_IsDown = outHist < outHist[1] and outHist > 0
histB_IsDown = outHist < outHist[1] and outHist <= 0
histB_IsUp = outHist > outHist[1] and outHist <= 0

//MacD Color Definitions
macd_IsAbove = outMacD >= outSignal
macd_IsBelow = outMacD < outSignal

plot_color = hist_colorChange ? histA_IsUp ? aqua : histA_IsDown ? blue : histB_IsDown ? red : histB_IsUp ? maroon :yellow :gray
macd_color = macd_colorChange ? macd_IsAbove ? lime : red : red
signal_color = macd_colorChange ? macd_IsAbove ? yellow : yellow : lime

circleYPosition = outSignal

plot(smd and outMacD ? outMacD : na, title="MACD", color=macd_color, linewidth=4)
plot(smd and outSignal ? outSignal : na, title="Signal Line", color=signal_color, style=line ,linewidth=2)
plot(sh and outHist ? outHist : na, title="Histogram", color=plot_color, style=histogram, linewidth=4)
plot(sd and cross(outMacD, outSignal) ? circleYPosition : na, title="Cross", style=circles, linewidth=4, color=macd_color)
// hline(0, '0 Line', linestyle=solid, linewidth=2, color=white)

macd_chk=smd and outMacD ? outMacD : na
checker=smd and outSignal ? outSignal : na
if (crossover(macd_chk,checker))
    strategy.entry("BBandLE", strategy.long, comment="BBandLE")

if (crossunder(macd_chk, checker))
    strategy.entry("BBandSE", strategy.short, comment="BBandSE")