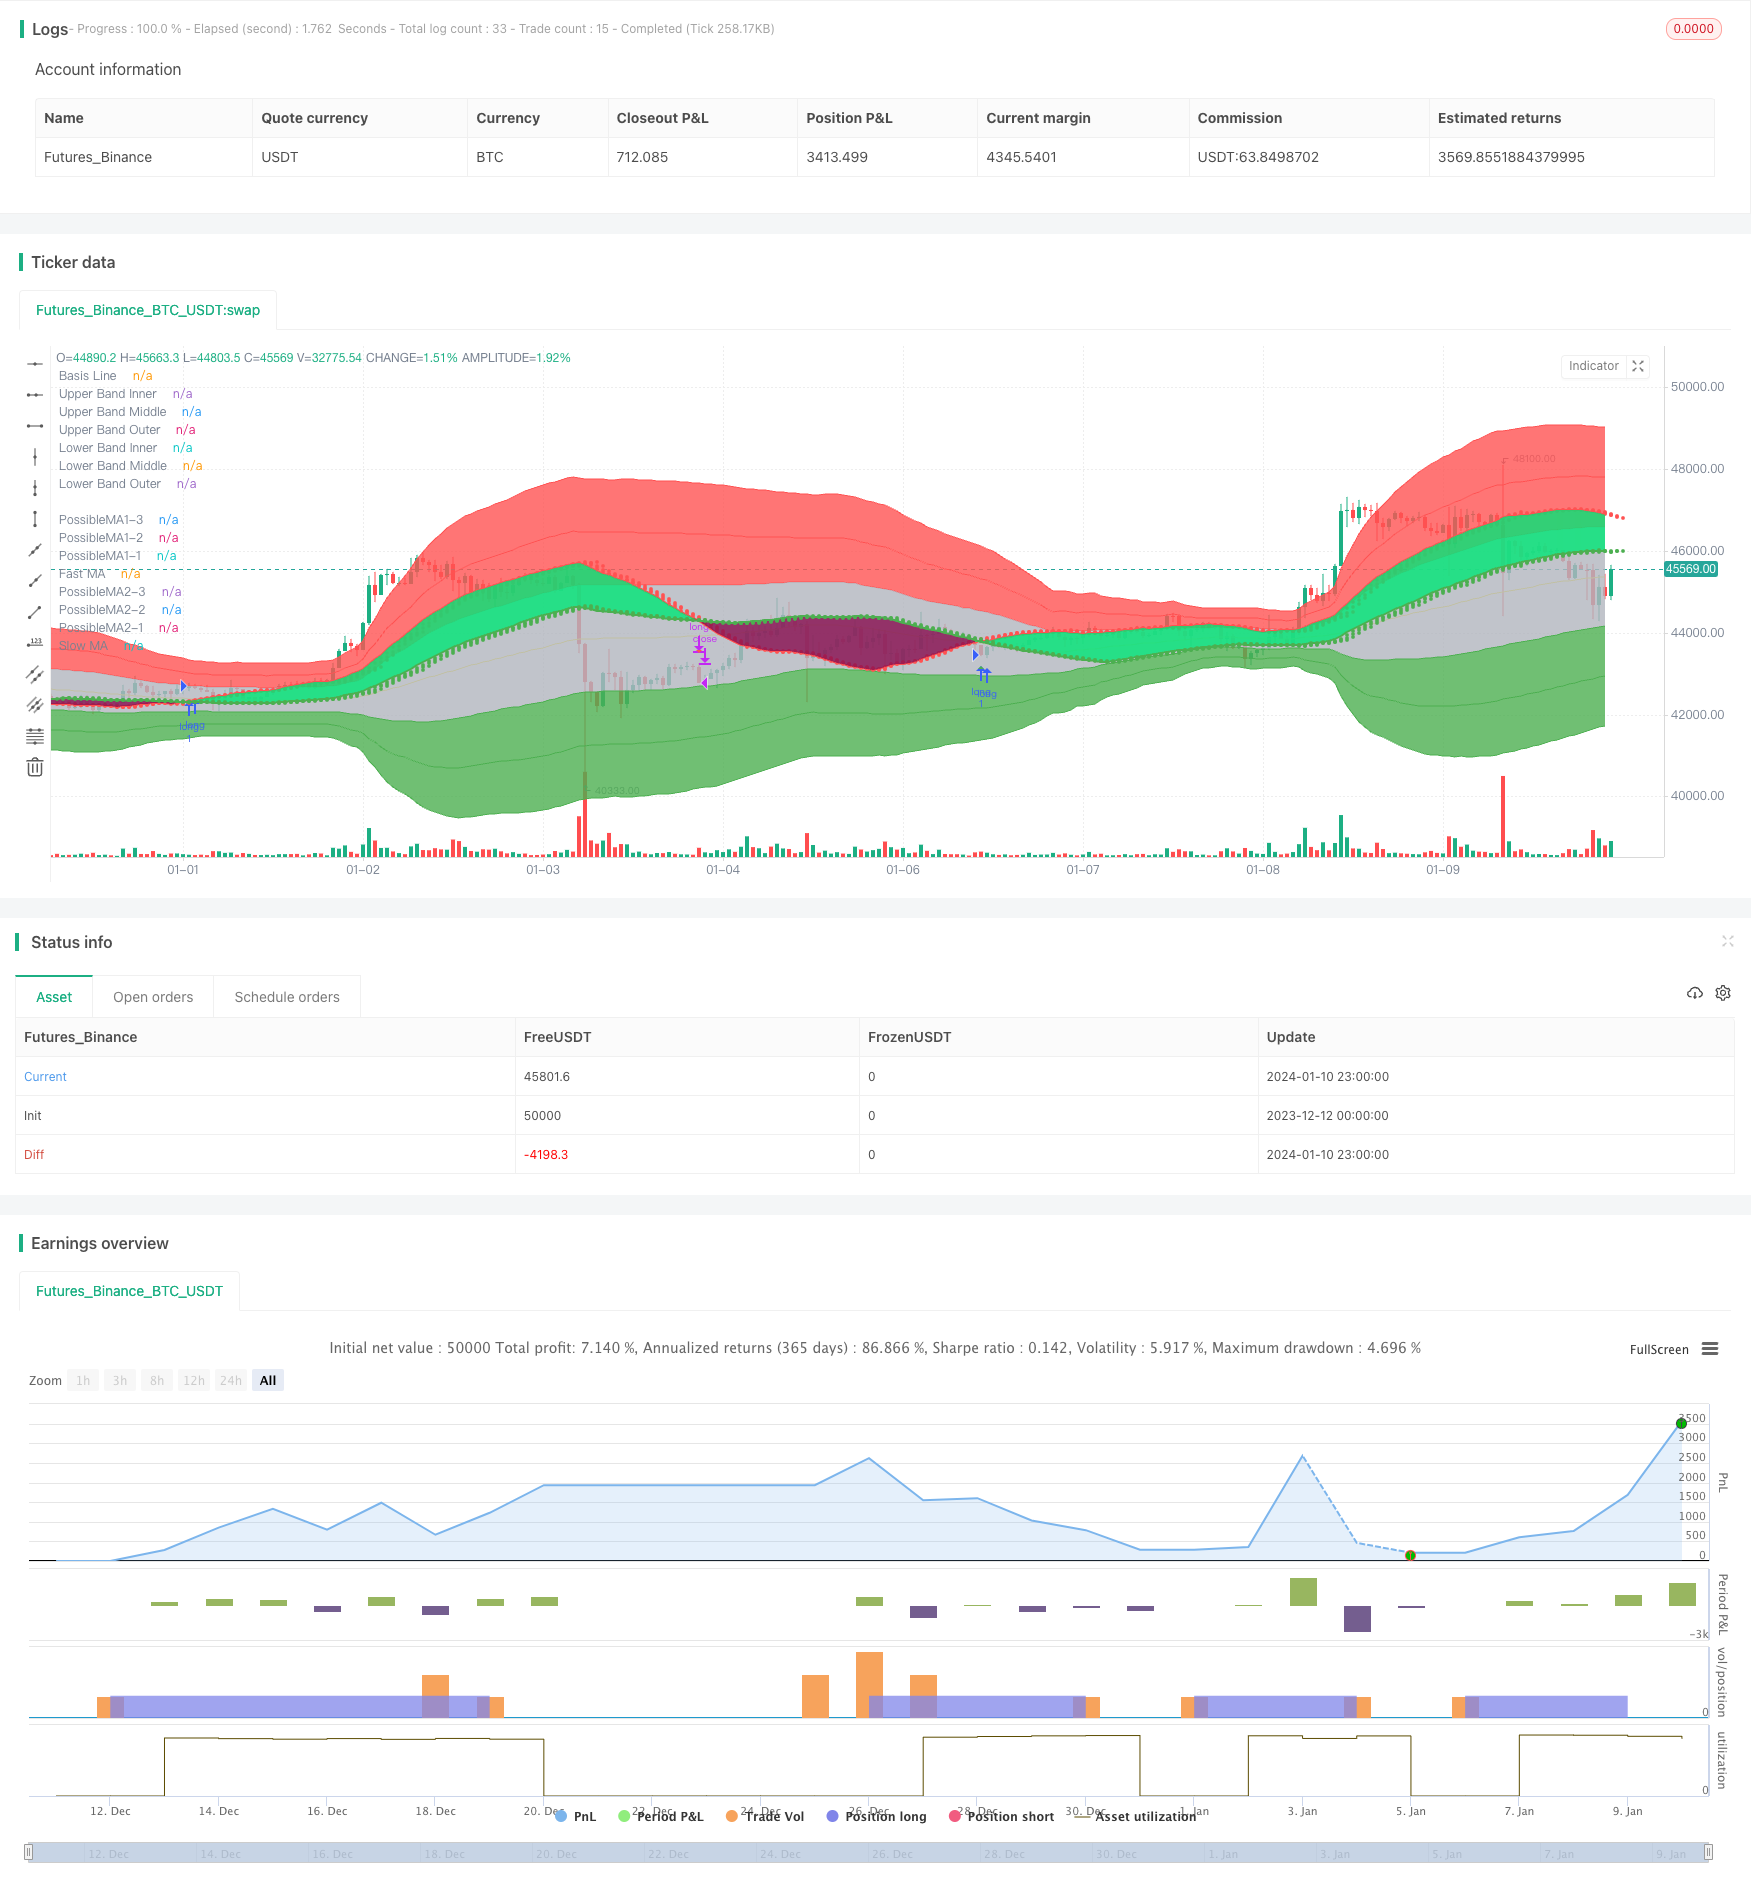
概述
该策略通过计算两个不同周期的动能加权移动平均线(MAEMA),在它们交叉时产生买入和卖出信号。其中,短周期线用于判断市场趋势和短期反转信号,而长周期线用于确定主要趋势方向。
原理
- 计算快线(80周期)和慢线(144周期)的MAEMA。
- 快线反映短期趋势和反转点。慢线反映主要趋势方向。
- 当快线上穿慢线时,产生买入信号。当快线下穿慢线时,产生卖出信号。
- 该策略同时绘制了3个预测点,表示下一个周期的可能值,从而判断未来的交叉趋势。
- 策略中充分利用MAEMA指标本身的动量性和预测功能。
优势分析
- MAEMA本身集成了动量因子,能更快捕捉趋势的变化。
- 双均线策略,判断不同时间段内的趋势方向。
- 结合快慢线的交叉以及MAEMA自身的预测点,使买卖信号更可靠。
- 自动绘图完整,直观反映市场波动。
风险分析
- 市场出现异常波动时,MAEMA指标的灵敏度可能过高,产生错误信号。可以适当放宽停损点。
- 均线系统对于横盘市容易产生虚假信号。可以增加其他过滤器。
- 快线和慢线的周期设置需要根据不同品种确定最佳参数。
优化方向
- 优化MAEMA快线和慢线的周期参数,找到最佳参数组合。
- 增加过滤条件,避免在震荡行情中打开仓位。例如引入DMI、MACD等判断趋势性。
- 根据回测结果不断调整ATR系数、移动止损点来降低False positive并控制风险。
总结
该策略利用动能加权移动平均线双均线交叉判断市场趋势变化,基本原理清晰简单。结合MAEMA自身的动量和预测功能,识别反转信号的效果较好。需要注意参数优化以及加强过滤条件,加强稳定性。
策略源码
/*backtest
start: 2023-12-12 00:00:00
end: 2024-01-11 00:00:00
period: 1h
basePeriod: 15m
exchanges: [{"eid":"Futures_Binance","currency":"BTC_USDT"}]
*/

// © informanerd
//@version=4

strategy("MultiType Shifting Predictive MAs Crossover", shorttitle = "MTSPMAC + MBHB Strategy", overlay = true)

//inputs

predict = input(true, "Show MA Prediction Tails")
trendFill = input(true, "Fill Between MAs Based on Trend")
signal = input(true, "Show Cross Direction Signals")

showMA1 = input(true, "[ Show Fast Moving Average ]══════════")
type1 = input("MAEMA (Momentum Adjusted Exponential)", "Fast MA Type", options = ["MAEMA (Momentum Adjusted Exponential)", "DEMA (Double Exponential)", "EMA (Exponential)", "HMA (Hull)", "LSMA (Least Squares)", "RMA (Adjusted Exponential)", "SMA (Simple)", "SWMA (Symmetrically Weighted)", "TEMA (Triple Exponential)", "TMA (Triangular)", "VMA / VIDYA (Variable Index Dynamic Average)", "VWMA (Volume Weighted)", "WMA (Weighted)"])
src1 = input(high, "Fast MA Source")
len1 = input(80, "Fast MA Length", minval = 2)
shift1 = input(0, "Fast MA Shift")
maThickness1 = input(2, "Fast MA Thickness", minval = 1)
trendColor1 = input(false, "Color Fast MA Based on Detected Trend")
showBand1 = input(false, "Show Fast MA Range Band")
atrPer1 = input(20, "Fast Band ATR Lookback Period")
atrMult1 = input(3, "Fast Band ATR Multiplier")

showMA2 = input(true, "[ Show Slow Moving Average ]══════════")
type2 = input("MAEMA (Momentum Adjusted Exponential)", "Slow MA Type", options = ["MAEMA (Momentum Adjusted Exponential)", "DEMA (Double Exponential)", "EMA (Exponential)", "HMA (Hull)", "LSMA (Least Squares)", "RMA (Adjusted Exponential)", "SMA (Simple)", "SWMA (Symmetrically Weighted)", "TEMA (Triple Exponential)", "TMA (Triangular)", "VMA / VIDYA (Variable Index Dynamic Average)", "VWMA (Volume Weighted)", "WMA (Weighted)"])
src2 = input(close, "Slow MA Source")
len2 = input(144, "Slow MA Length", minval = 2)
shift2 = input(0, "Slow MA Shift")
maThickness2 = input(2, "Slow MA Thickness", minval = 1)
trendColor2 = input(false, "Color Slow MA Based on Detected Trend")
showBand2 = input(false, "Show Slow MA Range Band")
atrPer2 = input(20, "Slow Band ATR Lookback Period")
atrMult2 = input(3, "Slow Band ATR Multiplier")

//ma calculations

ma(type, src, len) =>
    if type == "MAEMA (Momentum Adjusted Exponential)"
        goldenRatio = (1 + sqrt(5)) / 2
        momentumLen = round(len / goldenRatio), momentum = change(src, momentumLen), probabilityLen = len / goldenRatio / goldenRatio
        ema(src + (momentum + change(momentum, momentumLen) * 0.5) * sum(change(src) > 0 ? 1 : 0, round(probabilityLen)) / probabilityLen, len)
    else if type == "DEMA (Double Exponential)"
        2 * ema(src, len) - ema(ema(src, len), len)
    else if type == "EMA (Exponential)"
        ema(src, len)
    else if type == "HMA (Hull)"
        wma(2 * wma(src, len / 2) - wma(src, len), round(sqrt(len)))
    else if type == "LSMA (Least Squares)"
        3 * wma(src, len) - 2 * sma(src, len)
    else if type == "RMA (Adjusted Exponential)"
        rma(src, len)
    else if type == "SMA (Simple)"
        sma(src, len)
    else if type == "SWMA (Symmetrically Weighted)"
        swma(src)
    else if type == "TEMA (Triple Exponential)"
        3 * ema(src, len) - 3 * ema(ema(src, len), len) + ema(ema(ema(src, len), len), len)
    else if type == "TMA (Triangular)"
        swma(wma(src, len))
    else if type == "VMA / VIDYA (Variable Index Dynamic Average)"
        smoothing = 2 / len, volIndex = abs(cmo(src, len) / 100)
        vma = 0., vma := (smoothing * volIndex * src) + (1 - smoothing * volIndex) * nz(vma[1])
    else if type == "VWMA (Volume Weighted)"
        vwma(src, len)
    else if type == "WMA (Weighted)"
        wma(src, len)

ma1 = ma(type1, src1, len1)
ma2 = ma(type2, src2, len2)

//ma predictions

pma11 = len1 > 2 ? (ma(type1, src1, len1 - 1) * (len1 - 1) + src1 * 1) / len1 : na
pma12 = len1 > 3 ? (ma(type1, src1, len1 - 2) * (len1 - 2) + src1 * 2) / len1 : na
pma13 = len1 > 4 ? (ma(type1, src1, len1 - 3) * (len1 - 3) + src1 * 3) / len1 : na

pma21 = len2 > 2 ? (ma(type2, src2, len2 - 1) * (len2 - 1) + src2 * 1) / len2 : na
pma22 = len2 > 3 ? (ma(type2, src2, len2 - 2) * (len2 - 2) + src2 * 2) / len2 : na
pma23 = len2 > 4 ? (ma(type2, src2, len2 - 3) * (len2 - 3) + src2 * 3) / len2 : na

//ma range bands

r1 = atr(atrPer1) * atrMult1
hBand1 = ma1 + r1
lBand1 = ma1 - r1

r2 = atr(atrPer2) * atrMult2
hBand2 = ma2 + r2
lBand2 = ma2 - r2

//drawings

ma1Plot = plot(showMA1 ? ma1 : na, "Fast MA", trendColor1 and ma1 > src1 ? color.maroon : trendColor1 and ma1 < src1 ? color.lime : trendColor1 ? color.gray : color.red, maThickness1, offset = shift1)
ma2Plot = plot(showMA2 ? ma2 : na, "Slow MA", trendColor2 and ma2 > src2 ? color.maroon : trendColor2 and ma2 < src2 ? color.lime : trendColor2 ? color.gray : color.green, maThickness2, offset = shift2)
fill(ma1Plot, ma2Plot, trendFill and ma1 > ma2 ? color.lime : trendFill and ma1 < ma2 ? color.maroon : na, 90)

plot(showMA1 and predict ? pma11 : na, "PossibleMA1-1", trendColor1 and ma1 > src1 ? color.maroon : trendColor1 and ma1 < src1 ? color.lime : trendColor1 ? color.gray : color.red, style = plot.style_circles, offset = shift1 + 1, show_last = 1)
plot(showMA1 and predict ? pma12 : na, "PossibleMA1-2", trendColor1 and ma1 > src1 ? color.maroon : trendColor1 and ma1 < src1 ? color.lime : trendColor1 ? color.gray : color.red, style = plot.style_circles, offset = shift1 + 2, show_last = 1)
plot(showMA1 and predict ? pma13 : na, "PossibleMA1-3", trendColor1 and ma1 > src1 ? color.maroon : trendColor1 and ma1 < src1 ? color.lime : trendColor1 ? color.gray : color.red, style = plot.style_circles, offset = shift1 + 3, show_last = 1)
plot(showMA2 and predict ? pma21 : na, "PossibleMA2-1", trendColor2 and ma2 > src2 ? color.maroon : trendColor2 and ma2 < src2 ? color.lime : trendColor2 ? color.gray : color.green, style = plot.style_circles, offset = shift2 + 1, show_last = 1)
plot(showMA2 and predict ? pma22 : na, "PossibleMA2-2", trendColor2 and ma2 > src2 ? color.maroon : trendColor2 and ma2 < src2 ? color.lime : trendColor2 ? color.gray : color.green, style = plot.style_circles, offset = shift2 + 2, show_last = 1)
plot(showMA2 and predict ? pma23 : na, "PossibleMA2-3", trendColor2 and ma2 > src2 ? color.maroon : trendColor2 and ma2 < src2 ? color.lime : trendColor2 ? color.gray : color.green, style = plot.style_circles, offset = shift2 + 3, show_last = 1)

plot(showBand1 ? hBand1 : na, "Fast Higher Band", trendColor1 and ma1 > src1 ? color.maroon : trendColor1 and ma1 < src1 ? color.lime : trendColor1 ? color.gray : color.red, offset = shift1)
plot(showBand1 ? lBand1 : na, "Fast Lower Band", trendColor1 and ma1 > src1 ? color.maroon : trendColor1 and ma1 < src1 ? color.lime : trendColor1 ? color.gray : color.red, offset = shift1)
plot(showBand2 ? hBand2 : na, "Slow Higher Band", trendColor2 and ma2 > src2 ? color.maroon : trendColor2 and ma2 < src2 ? color.lime : trendColor2 ? color.gray : color.green, offset = shift2)
plot(showBand2 ? lBand2 : na, "Slow Lower Band", trendColor2 and ma2 > src2 ? color.maroon : trendColor2 and ma2 < src2 ? color.lime : trendColor2 ? color.gray : color.green, offset = shift2)

//crosses & alerts

up = crossover(ma1, ma2)
down = crossover(ma2, ma1)

plotshape(signal ? up : na, "Buy", shape.triangleup, location.belowbar, color.green, offset = shift1, size = size.small)
plotshape(signal ? down : na, "Sell", shape.triangledown, location.abovebar, color.red, offset = shift1, size = size.small)

alertcondition(up, "Buy", "Buy")
alertcondition(down, "Sell", "Sell")

// @version=1

// Title: "Multi Bollinger Heat Bands - EMA/Breakout options".
// Author: JayRogers
//
// * Description *
//   Short: It's your Basic Bollinger Bands, but 3 of them, and some pointy things.
//
//   Long:  Three stacked sma based Bollinger Bands designed just to give you a quick visual on the "heat" of movement.
//          Set inner band as you would expect, then set your preferred additional multiplier increments for the outer 2 bands.
//          Option to use EMA as alternative basis, rather than SMA.
//          Breakout indication shapes, which have their own multiplier seperate from the BB's; but still tied to same length/period.

// strategy(shorttitle="[JR]MBHB_EBO", title="[JR] Multi Bollinger Heat Bands - EMA/Breakout options", overlay=true)

// Bollinger Bands Inputs
bb_use_ema = input(false, title="Use EMA Basis?")
bb_length = input(80, minval=1, title="Bollinger Length")
bb_source = input(close, title="Bollinger Source")
bb_mult = input(1.0, title="Base Multiplier", minval=0.001, maxval=50)
bb_mult_inc = input(1, title="Multiplier Increment", minval=0.001, maxval=2)
// Breakout Indicator Inputs
break_mult = input(3, title="Breakout Multiplier", minval=0.001, maxval=50)
breakhigh_source = input(high, title="High Break Source")
breaklow_source = input(low, title="Low Break Source")

bb_basis = bb_use_ema ? ema(bb_source, bb_length) : sma(bb_source, bb_length)

// Deviation
// * I'm sure there's a way I could write some of this cleaner, but meh.
dev = stdev(bb_source, bb_length)
bb_dev_inner = bb_mult * dev
bb_dev_mid = (bb_mult + bb_mult_inc) * dev
bb_dev_outer = (bb_mult + (bb_mult_inc * 2)) * dev
break_dev = break_mult * dev

// Upper bands
inner_high = bb_basis + bb_dev_inner
mid_high = bb_basis + bb_dev_mid
outer_high = bb_basis + bb_dev_outer
// Lower Bands
inner_low = bb_basis - bb_dev_inner
mid_low = bb_basis - bb_dev_mid
outer_low = bb_basis - bb_dev_outer

// Breakout Deviation
break_high = bb_basis + break_dev
break_low = bb_basis - break_dev

// plot basis
plot(bb_basis, title="Basis Line", color=color.yellow, transp=50)

// plot and fill upper bands
ubi = plot(inner_high, title="Upper Band Inner", color=color.red, transp=90)
ubm = plot(mid_high, title="Upper Band Middle", color=color.red, transp=85)
ubo = plot(outer_high, title="Upper Band Outer", color=color.red, transp=80)
fill(ubi, ubm, title="Upper Bands Inner Fill", color=color.red, transp=90)
fill(ubm, ubo, title="Upper Bands Outer Fill",color=color.red, transp=80)

// plot and fill lower bands
lbi = plot(inner_low, title="Lower Band Inner", color=color.green, transp=90)
lbm = plot(mid_low, title="Lower Band Middle", color=color.green, transp=85)
lbo = plot(outer_low, title="Lower Band Outer", color=color.green, transp=80)
fill(lbi, lbm, title="Lower Bands Inner Fill", color=color.green, transp=90)
fill(lbm, lbo, title="Lower Bands Outer Fill", color=color.green, transp=80)

// center channel fill
fill(ubi, lbi, title="Center Channel Fill", color=color.silver, transp=100)

// plot breakouts
plotshape(breakhigh_source >= break_high, title="High Breakout", style=shape.triangledown, location=location.abovebar, size=size.tiny, color=color.white, transp=0)
plotshape(breaklow_source <= break_low, title="Low Breakout", style=shape.triangleup, location=location.belowbar, size=size.tiny, color=color.white, transp=0)
High_Break = breakhigh_source >= break_high
Low_Break = breaklow_source <= break_low

// Conditions
Stop_Momentum = low < ma1

//Strategy Tester

strategy.entry("long", strategy.long, when=(up and (hlc3 < inner_high)))
strategy.close("long", when=down)

strategy.entry("longwickdown", strategy.long, when=Low_Break)
strategy.close("longwickdown", when=(high > ma1))

//true signals test

//var winCount = 0, var loseCount = 0, testBarIndex = 1
//if (up[testBarIndex] and close > close[testBarIndex]) or (down[testBarIndex] and close < close[testBarIndex])
//    label.new(bar_index, 0, "W", yloc = yloc.abovebar, color = color.green)
//    winCount := winCount + 1
//else if (up[testBarIndex] and close < close[testBarIndex]) or (down[testBarIndex] and close > close[testBarIndex])
//    label.new(bar_index, 0, "L", yloc = yloc.abovebar, color = color.red)
//    loseCount := loseCount + 1
//winRate = label.new(time + (time - time[1]) * 2, ohlc4, tostring(round(winCount / (winCount + loseCount) * 100)) + "%", xloc = xloc.bar_time, color = color.orange, style = label.style_label_left)
//if not na(winRate[1])
//    label.delete(winRate[1])