概述
Volume Ratio反转交易策略(VR反转策略)是一个 based on volume indicator 的短周期反转交易策略。它通过计算某一时间段内的成交量与均量的比值,来判断市场主力是否进入,从而产生交易信号。该策略主要适用于短线范围内反转性较强的品种。
策略原理
VR反转策略的核心指标是 Volume Ratio(简称VR),它代表了当前周期的成交量相对于一段时间内的平均成交量的比值。具体计算方法是:
VR = Current Volume / SMA(Volume, N)
其中N代表参数Length,当前周期成交量除以Length周期内成交量的简单移动平均。
当VR > 阈值时,认为是主力进入的信号。此时结合价格的向上或向下突破,产生买入和卖出信号。
该策略同时引入方向辅助判断指标dir。它通过当前周期收盘价与N周期前收盘价比较,大于1为多头方向,小于1为空头方向。
在VR大于指定阈值时,如果dir=1,产生买入信号,如果dir=-1,产生卖出信号。
优势
VR反转策略最大的优势在于捕捉突发性的价格反转机会。当出现主力介入的信号时,策略可以快速做出判断,及时捕捉反弹或回落的机会。
其他优势还有:
- 使用成交量指标,对市场主力的判断相对可靠
- 算法简单,容易理解和实施
- 可配置参数灵活,适应性较好
风险
尽管VR反转策略有一定的优势,但也存在一些风险需要注意:
- 作为短线策略,存在一定的随机性,收益曲线可能比较起伏
- VR指标可能出现失效的情况,无法准确判断主力
- 需选择参数恰当的品种,如果波动平缓则效果不佳
此外,也需要注意防止过度交易、设置止损以控制单笔损失等。
优化建议
VR反转策略还有进一步优化的空间,主要建议如下:
- 结合更多指标进行判断,避免VR指标的失效情况
- 添加止损逻辑,可以参考ATR指标设定止损幅度
- 优化参数,特别是Length周期参数,针对不同周期和品种调整
- 根据回测结果,调整正反向的VR阈值,确保其稳健性
总结
VR反转交易策略是一个简单直接、容易实施的短线量化策略。它通过捕捉主力出现的信号,抓住反转机会。该策略特别适合波动比较剧烈、反转明显的品种,但也需要注意风险控制。通过进一步优化,可以使策略更稳健,过滤掉更多假信号。
策略源码
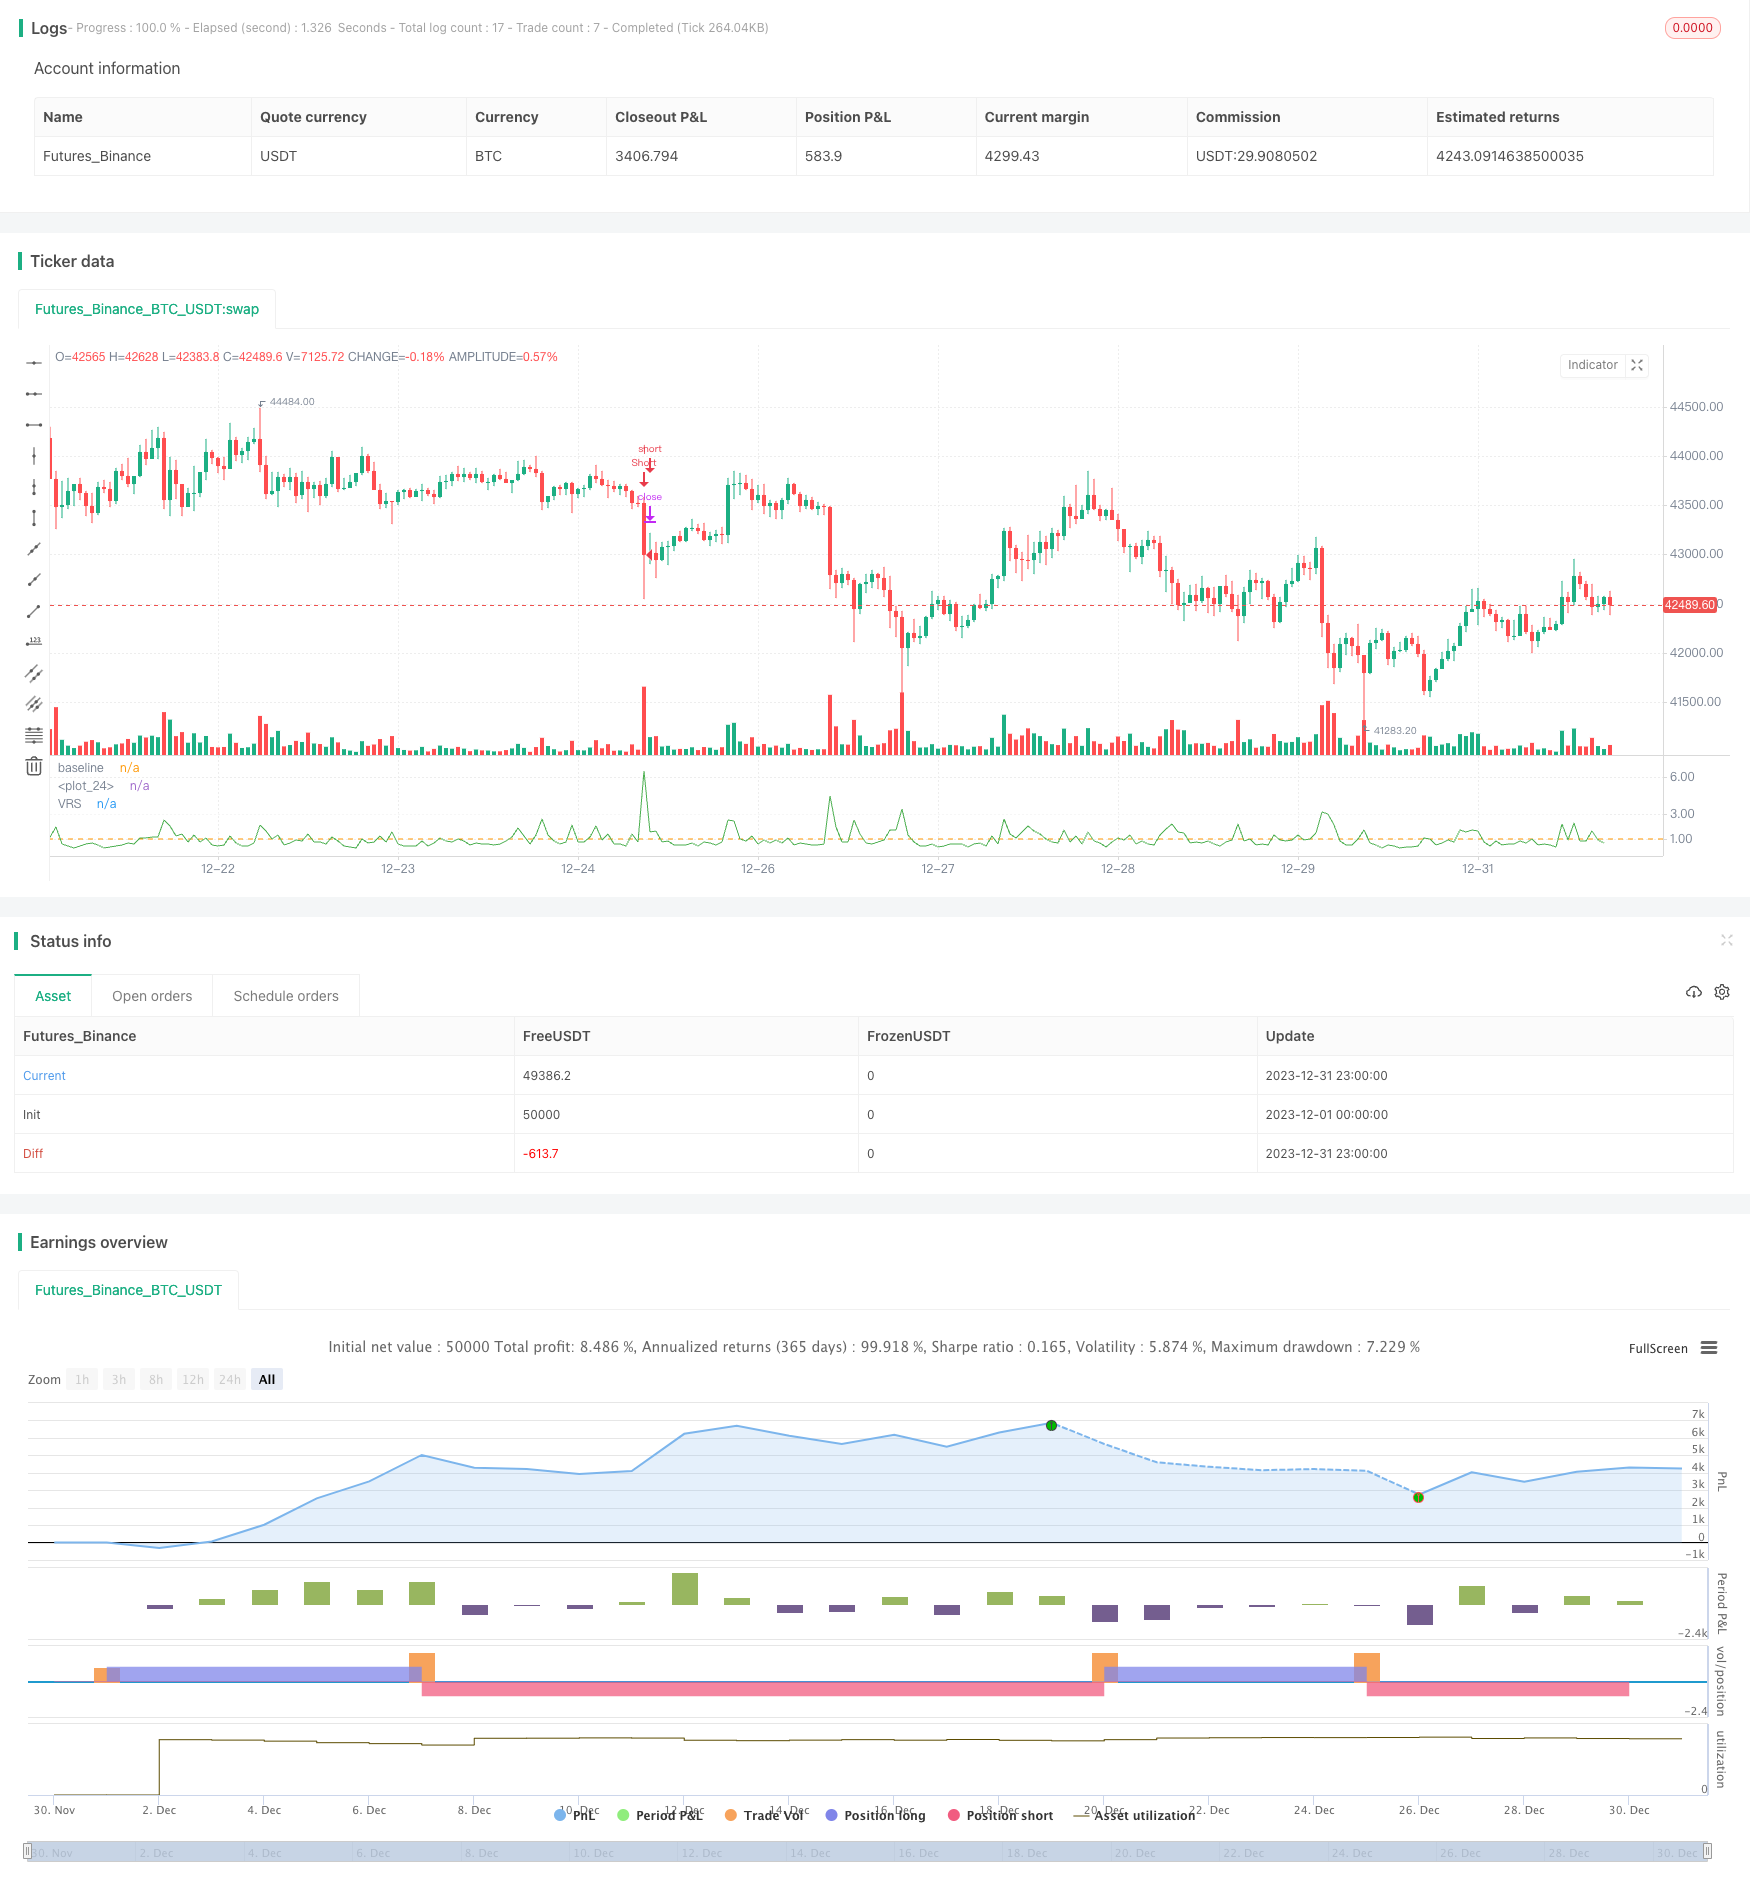
/*backtest
start: 2023-12-01 00:00:00
end: 2023-12-31 23:59:59
period: 1h
basePeriod: 15m
exchanges: [{"eid":"Futures_Binance","currency":"BTC_USDT"}]
*/

//@version=4

strategy(title="Volume Ratio_30min", shorttitle="VR_30min")//,initial_capital=1000)

// User Input ------------------------------------------------------------------
len = input(20, title="Length", minval=1)
threshold  = input(3,step=0.05, title="閾値")

// Volume Caliculetion ---------------------------------------------------------
vol = volume
sma=sma(volume,len)
vrs = vol / sma

// Direction -------------------------------------------------------------------
dirtime=input(1,"direction picker # bars")
dir=if close/close[dirtime] > 1
    1
else
    -1

// Plot ------------------------------------------------------------------------
plot(vrs, title="VRS",  color=color.green, transp=0)
hline(1, title="baseline")
plot(threshold, color=color.white)

// ️⚠️⚠️Logic -----------------------------------------------------------------

long    = vrs > threshold  and dir == 1
short   = vrs > threshold  and dir ==-1

// Back Test Fnction -----------------------------------------------------------
start = timestamp(input(2019, "Start Year"), input(1, "Start Month"), input(1, "Start Day"), 0, 0)
end = timestamp(input(9999, "End Year"), input(1, "End Month"), input(1, "End Day"), 0, 0)
_testPeriod() => true

// Order -----------------------------------------------------------------------
if _testPeriod()
    if long
        strategy.entry("Long", strategy.long)
    if short
        strategy.entry("Short", strategy.short)