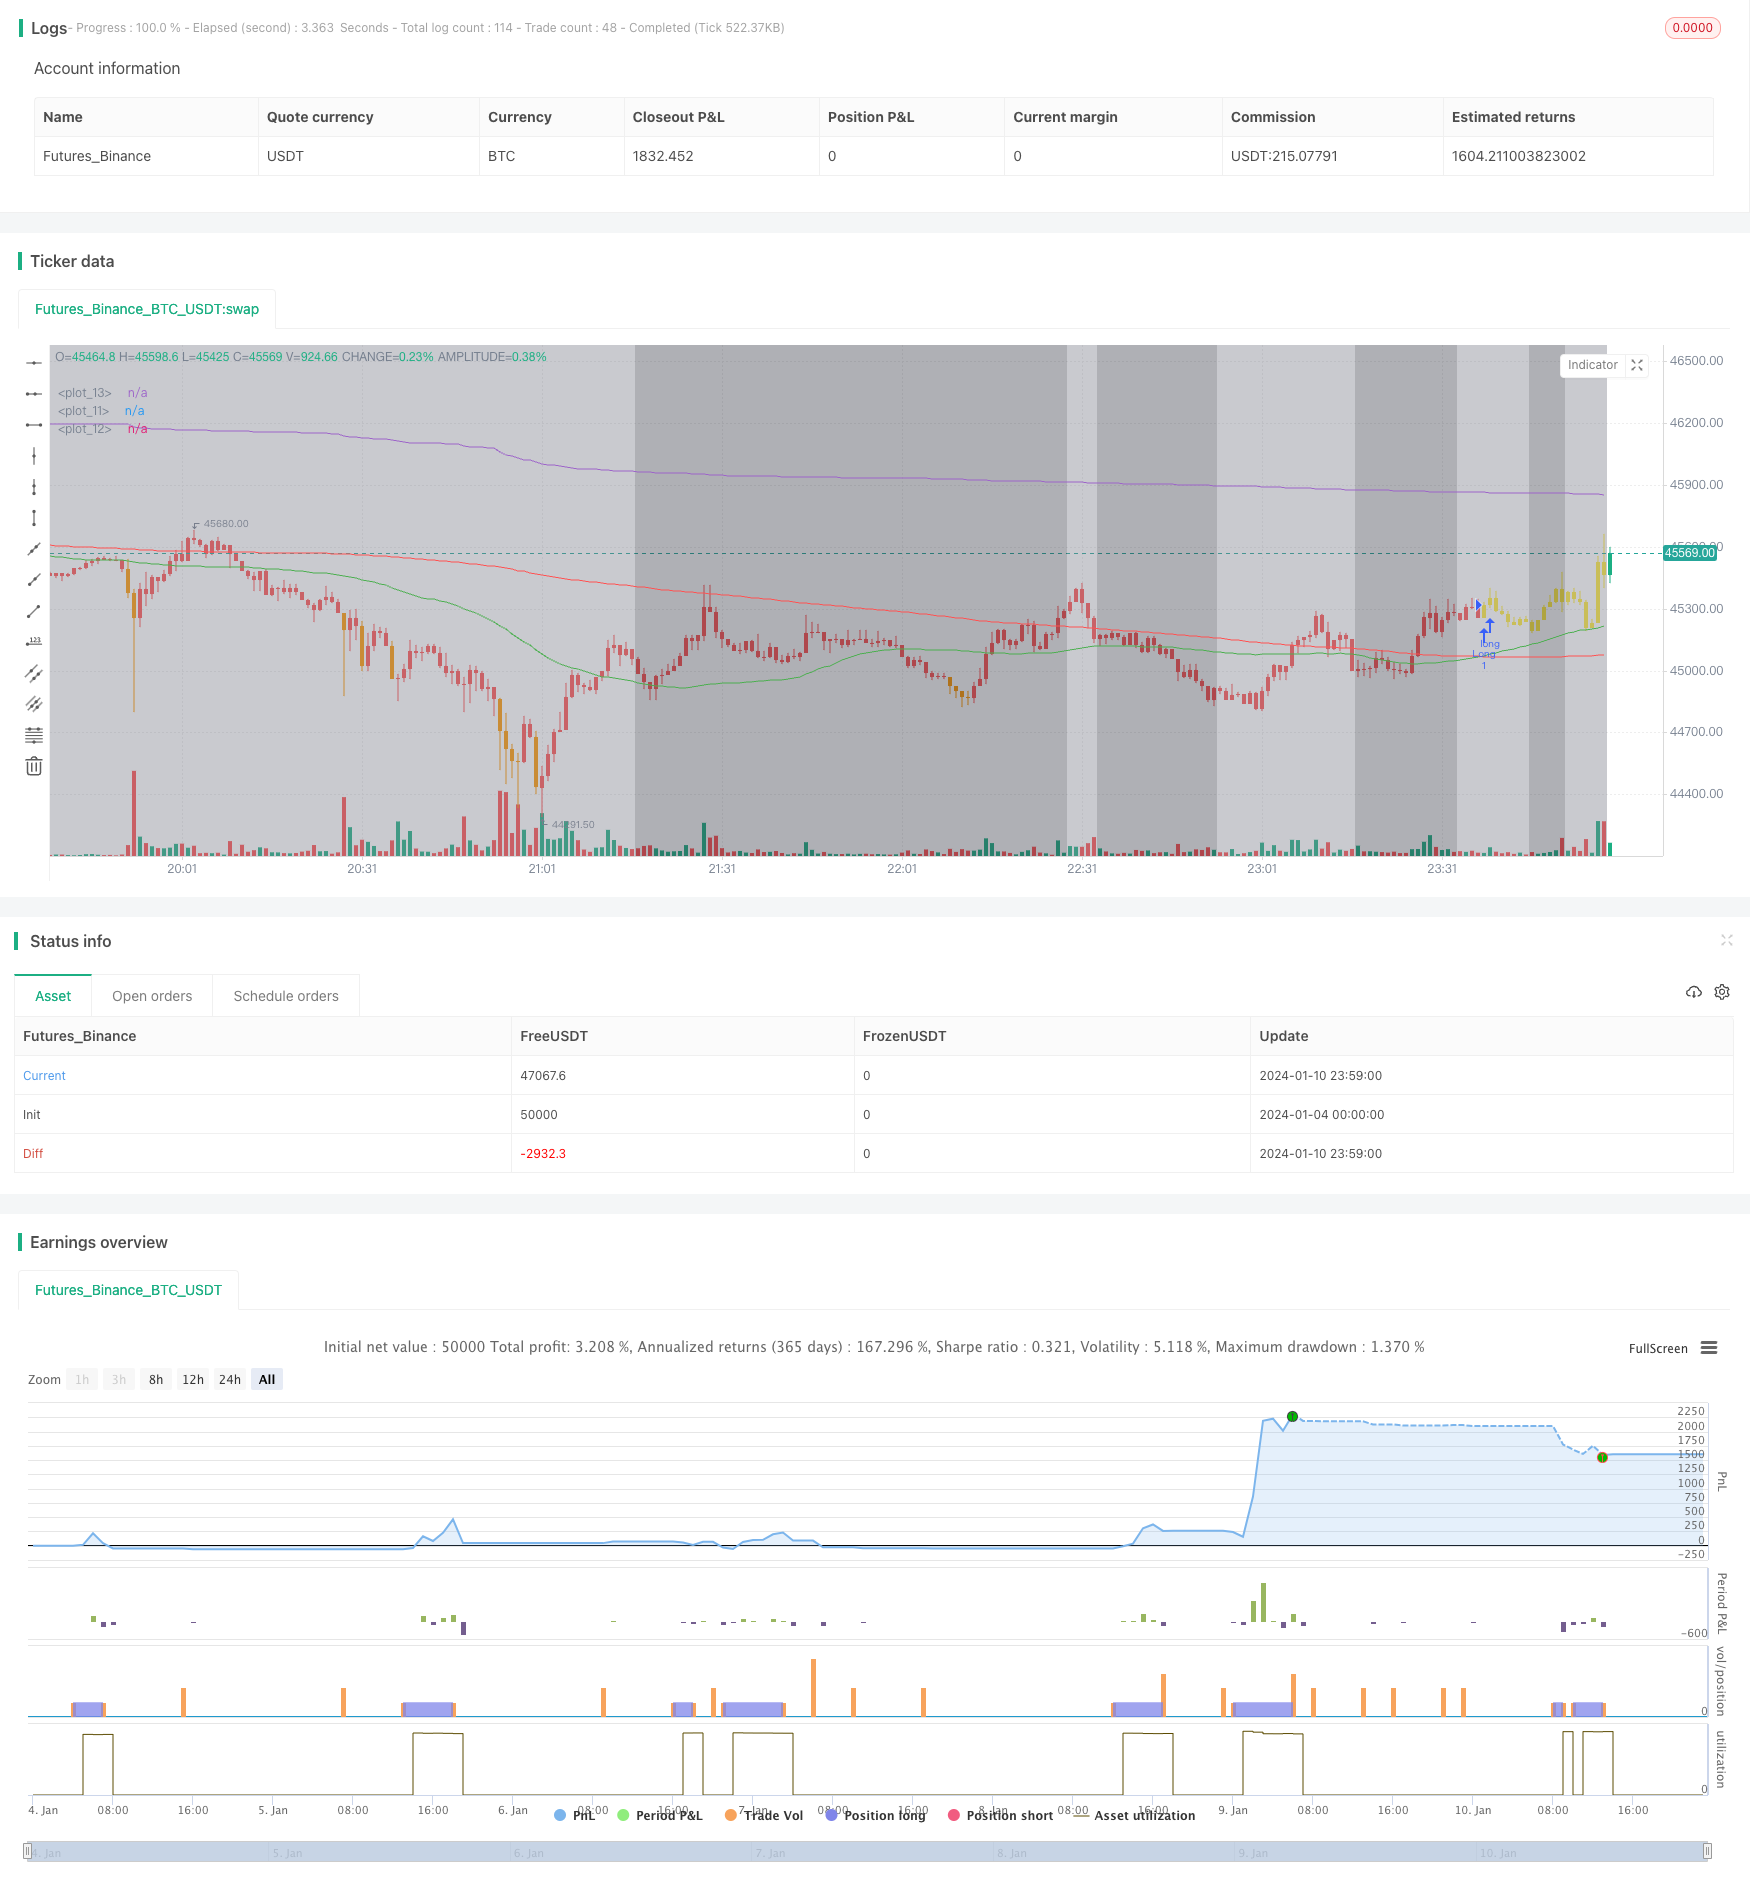
Momentum Breakthrough ATR Volatility Strategy

Author: ChaoZhang, Date: 2024-01-12 13:50:44
Tags:

img

Overview

This strategy utilizes a combination of simple moving average double moving average strategy, supplemented by ATR volatility index to determine market volatility. When the short-term average line crosses above the long-term average line, it is determined as a bull market and a long position is taken. When the short-term average line crosses below the long-term average line, it is determined as a bear market and a short position is taken. At the same time, the reliability of the moving average signal is judged by combining the volume weighted average price VWAP. In addition, RSI indicator is incorporated to avoid reversals. The ATR volatility index is used to determine market volatility so as to select trading during lower volatility periods.

Strategy Principle

The core is the double moving average strategy. The double moving average strategy typically selects a short-term moving average and a long-term moving average, such as the 50-day moving average and the 200-day moving average. A buy signal is generated when the short-term moving average crosses above the long-term moving average. A sell signal is generated when the short-term moving average crosses below the long-term moving average. The double moving average strategy judges changes in long-term and short-term market trends, and uses moving average breakthroughs to capture trend turning points.

This strategy selects the 50-day moving average as the short-term moving average and the 200-day moving average as the long-term moving average. Combined with the volume weighted average price VWAP to determine the reliability of the moving average signal. That is, only enter the market when the moving average signal is aligned with VWAP. This filters out some false signals.

In addition, the RSI indicator is incorporated to avoid overbuying and overselling. Avoid buying when RSI is above 70 and avoid selling when RSI is below 30.

Finally, the average amplitude of fluctuation of the ATR indicator is used to determine the volatility and risk level of the market. When the ATR value is greater than 1.18, it is defined as high volatility. At this point, by changing the background color, the higher risk is prompted and trading can be avoided temporarily until the volatility decreases.

Advantage Analysis

The main advantages of this strategy are reflected in three aspects:

  1. The double moving average captures the turning point of the medium and long-term trend in the market, and uses the trend trading to obtain relatively large profits.

  2. Combine VWAP to filter false signals and improve signal reliability.

  3. Introduction of RSI indicator to avoid trading against the market, which can reduce losses.

  4. Application of ATR volatility index to determine market risk conditions avoids high volatility periods, which can reduce losses.

  5. The combination of various indicators is simple and easy to understand and implement, suitable for quantitative trading entry.

Risk Analysis

This strategy also has some risks:

  1. When the moving average generates a signal, the price may have changed greatly, posing the risk of overtrading. The solution is to reduce the cycle of the moving average to speed up the reaction speed of the indicator.

  2. VWAP may have errors, resulting in filtering out correct trading signals. The solution is to confirm with other indicators.

  3. At the end of the trend, RSI may stay in the overbought/oversold area for a long time, missing the turning point of the trend reversal. The solution is to combine other indicators to confirm, such as MACD.

  4. ATR may lag when judging market volatility. The solution is to combine the highest price, the lowest price, etc. to determine market volatility.

  5. The return may not meet expectations and parameters need to be adjusted accordingly.

Optimization Direction

There is still great room for optimization in this strategy:

  1. Test more moving average combinations to find optimal parameters.

  2. Add more auxiliary indicators to filter signals. Such as MACD, KDJ etc.

  3. Optimize stop loss and take profit parameters to reduce losses and increase profits.

  4. Evaluate the difference in trading strategies between strong stocks and weak stocks for classification modeling.

  5. Incorporate machine learning algorithms such as RNN to automatically optimize parameters and evaluate strategies.

  6. Develop automated trading systems and connect to live trading for backtesting.

Summary

Overall, this strategy is a relatively simple trend tracking strategy. The core uses double moving averages to determine long and short term trends. Combine VWAP and RSI to process signals and apply ATR to assess risks. The strategy idea is simple and easy to understand and operate. Through some optimization space, good returns can be obtained. As a choice for quantitative trading entry, it is very suitable.


/*backtest
start: 2024-01-04 00:00:00
end: 2024-01-11 00:00:00
period: 1m
basePeriod: 1m
exchanges: [{"eid":"Futures_Binance","currency":"BTC_USDT"}]
*/

//@version=5
strategy("Simple Moving Averages", overlay=true)

sma50 = ta.sma(close, 50)
sma200 = ta.sma(close, 200)
vwap = ta.vwap(close)
rsi = ta.rsi(close, 14)
[diPlus, diMinus, adx_val] = ta.dmi(14, 14)
atr_val = ta.atr(14)

plot(sma50, color=color.new(color.green, 0))
plot(sma200, color=color.new(color.red, 0))
plot(vwap)

longCondition = ta.crossover(sma50, sma200) and vwap > close
shortCondition = ta.crossunder(sma50, sma200) and vwap < close

if (longCondition)
    strategy.entry("Long", strategy.long)
    
if (shortCondition)
    strategy.entry("Short", strategy.short)

barcolor = sma50 > sma200 ? (vwap < close ? (rsi < 70 ? color.green : color.blue) : color.yellow) : (sma50 < sma200 ? (vwap > close ? (rsi > 30 ? color.red : color.orange) : color.yellow) : na)
barcolor(barcolor)
bgcolor(adx_val > 25 and atr_val > 1.18 ? color.new(color.gray, 50) : color.new(color.black, 50), transp=90)

// ADX and ATR Label Box
// label.new(bar_index, high, "ADX: " + str.tostring(adx_val, "#.##") + "\nATR: " + str.tostring(atr_val, "#.##"), color=color.new(color.white, 0), textcolor=color.new(color.black, 0), style=label.style_labeldown, yloc=yloc.price, xloc=xloc.bar_index, size=size.small, textalign=text.align_left)

// Exit conditions (optional)
strategy.close("Long", when = ta.crossunder(sma50, sma200))
strategy.close("Short", when = ta.crossover(sma50, sma200))

// Take Profit and Stop Loss
takeProfitPercentage = 5
stopLossPercentage = 3

strategy.exit("Take Profit / Stop Loss", "Long", profit = takeProfitPercentage, loss = stopLossPercentage)
strategy.exit("Take Profit / Stop Loss", "Short", profit = takeProfitPercentage, loss = stopLossPercentage)

More