概述
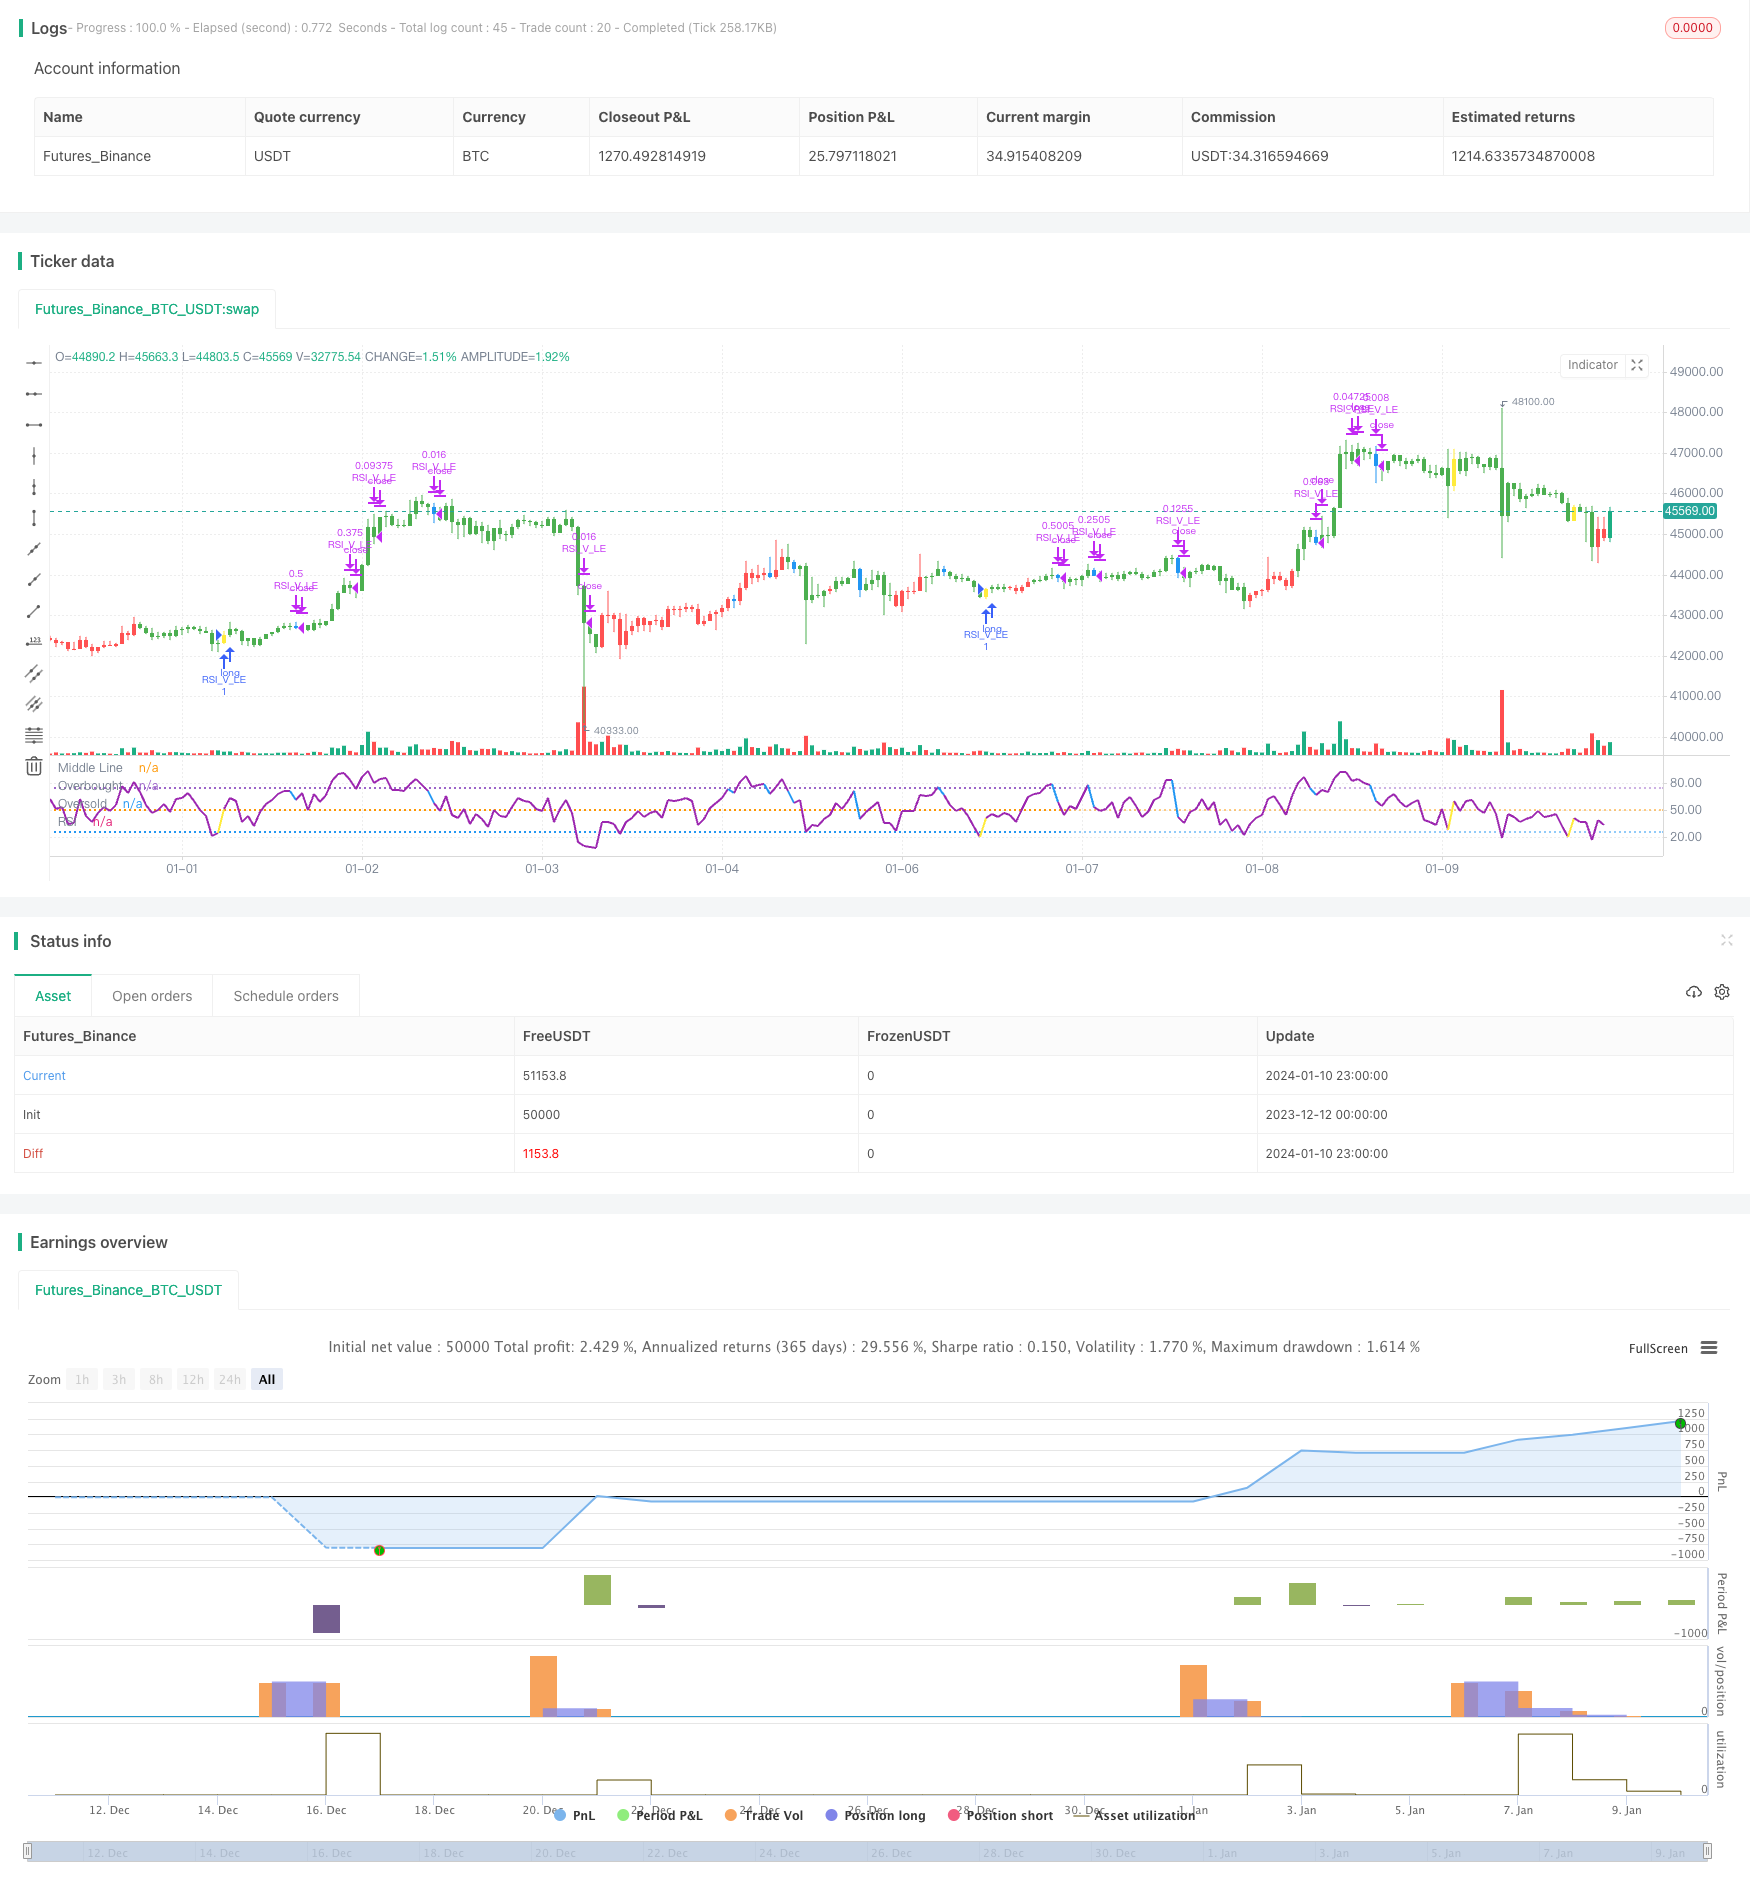
这个策略基于RSI指标的V形态,配合EMA均线过滤,形成较为可靠的短线盈利策略。它可以捕捉到价格在超卖区域反弹形成的机会,通过RSI指标的V形态信号精确做多,达到在短线上获利的目的。
策略原理
- 使用20日线在50日线之上作为长线多头的判断
- RSI形成V形态,表示超卖反弹机会
- 前一K线最低点低于前两K线的最低点
- 当前K线RSI高于前两根K线的RSI
- RSI上穿30作为V形态完成的信号,做多
- 止损设在入场价8%以下
- RSI穿过70开始 tzinfo 头寸,止损移至入场价
- RSI穿过90开始 tzinfo 3/4头寸
- RSI穿过10 / 止损触发,全部平仓
优势分析
- 使用EMA均线判断大趋势方向,避免逆势操作
- RSI V形态判断超卖区域反弹机会,捕捉反转趋势
- 多重止损机制控制风险
风险分析
- 大面市下行可能无法止损,造成较大亏损
- RSI V形态信号可能存在错误,导致不必要的亏损
优化方向
- 优化RSI参数,寻找更加可靠的RSI V形态
- 结合其他指标判断反转信号可靠性
- 优化止损策略,在防止过于激进的同时及时止损
总结
本策略整合EMA均线过滤和RSI V形态判断,形成了一套较为可靠的短线操作策略。它可以有效抓住超卖区域反弹的机会,在短线上实现盈利。通过不断优化参数和模型,完善止损机制,这套策略可以进一步增强稳定性和盈利能力。它为量化交易者打开了另一扇短线盈利的大门。
策略源码
/*backtest
start: 2023-12-12 00:00:00
end: 2024-01-11 00:00:00
period: 1h
basePeriod: 15m
exchanges: [{"eid":"Futures_Binance","currency":"BTC_USDT"}]
*/

// This source code is subject to the terms of the Mozilla Public License 2.0 at https://mozilla.org/MPL/2.0/
// © mohanee

//@version=4
//strategy("RSI V Pattern", overlay=true)
strategy(title="RSI V Pattern", overlay=false )

//Strategy Rules
//ema20 is above ema50  --- candles are colored  green on the chart
//RSI value sharply coming up which makes a V shape ,  colored in yellow on the chart
//RSI V pattern should occur from below 30

len = input(title="RSI Period", minval=1, defval=5)
stopLoss = input(title="Stop Loss %", minval=1, defval=8)

myRsi = rsi(close,len)

longEmaVal=ema(close,50)
shortEmaVal=ema(close,20)

//plot emas
//plot(longEmaVal, title="Long EMA" ,linewidth=2, color=color.orange, trackprice=true)
//plot(shortEmaVal, title="Short EMA" ,linewidth=2, color=color.green, trackprice=true)


longCondition =  ema(close,20)>ema(close,50)   and (low[1]<low[2] and  low[1]<low[3]) and (myRsi>myRsi[1] and myRsi>myRsi[2] ) and crossover(myRsi,30) //  (   and myRsi<60)

//(myRsi<60 and myRsi>30)  and myRsi>myRsi[1] and (myRsi[1]<myRsi[2]  or  myRsi[1]<myRsi[3]) and (myRsi[2]<30)  and (myRsi[3]<30 and myRsi[4]>=30)


barcolor(shortEmaVal>longEmaVal?color.green:color.red)
//longCondition = crossover(sma(close, 14), sma(close, 28))
barcolor(longCondition?color.yellow:na)
strategy.entry("RSI_V_LE", strategy.long, when=longCondition )
//stoploss value at 10%
stopLossValue=strategy.position_avg_price -  (strategy.position_avg_price*stopLoss/100)
//stopLossValue=valuewhen(longCondition,low,3)


//takeprofit at RSI highest  reading
//at RSI75 move the stopLoss to entry price
moveStopLossUp=strategy.position_size>0 and crossunder(myRsi,70)
barcolor(moveStopLossUp?color.blue:na)
stopLossValue:=crossover(myRsi,70) ? strategy.position_avg_price:stopLossValue

//stopLossValue:=moveStopLossUp?strategy.position_avg_price:stopLossValue
rsiPlotColor=longCondition ?color.yellow:color.purple
rsiPlotColor:= moveStopLossUp ?color.blue:rsiPlotColor
plot(myRsi, title="RSI", linewidth=2, color=rsiPlotColor)
//longCondition?color.yellow:#8D1699)
hline(50, title="Middle Line", linestyle=hline.style_dotted)
obLevel = hline(75, title="Overbought", linestyle=hline.style_dotted)
osLevel = hline(25, title="Oversold", linestyle=hline.style_dotted)
fill(obLevel, osLevel, title="Background", color=#9915FF, transp=90)


//when RSI crossing down 70 , close 1/2 position and move stop loss to average entry price
strategy.close("RSI_V_LE",  qty=strategy.position_size*1/2, when=strategy.position_size>0 and crossunder(myRsi,70))

//when RSI reaches high reading 90 and crossing down close 3/4 position
strategy.close("RSI_V_LE",  qty=strategy.position_size*3/4, when=strategy.position_size>0 and crossunder(myRsi,90))


//close everything when Rsi goes down below to 10 or stoploss hit
//just keeping RSI cross below 10 , can work as stop loss , which also keeps you long in the trade ... however sharp declines could  make large loss
//so I combine RSI goes below 10 OR stoploss hit  , whichever comes first - whole posiition closed
longCloseCondition=crossunder(myRsi,10)  or close<stopLossValue
strategy.close("RSI_V_LE", qty=strategy.position_size,when=longCloseCondition )