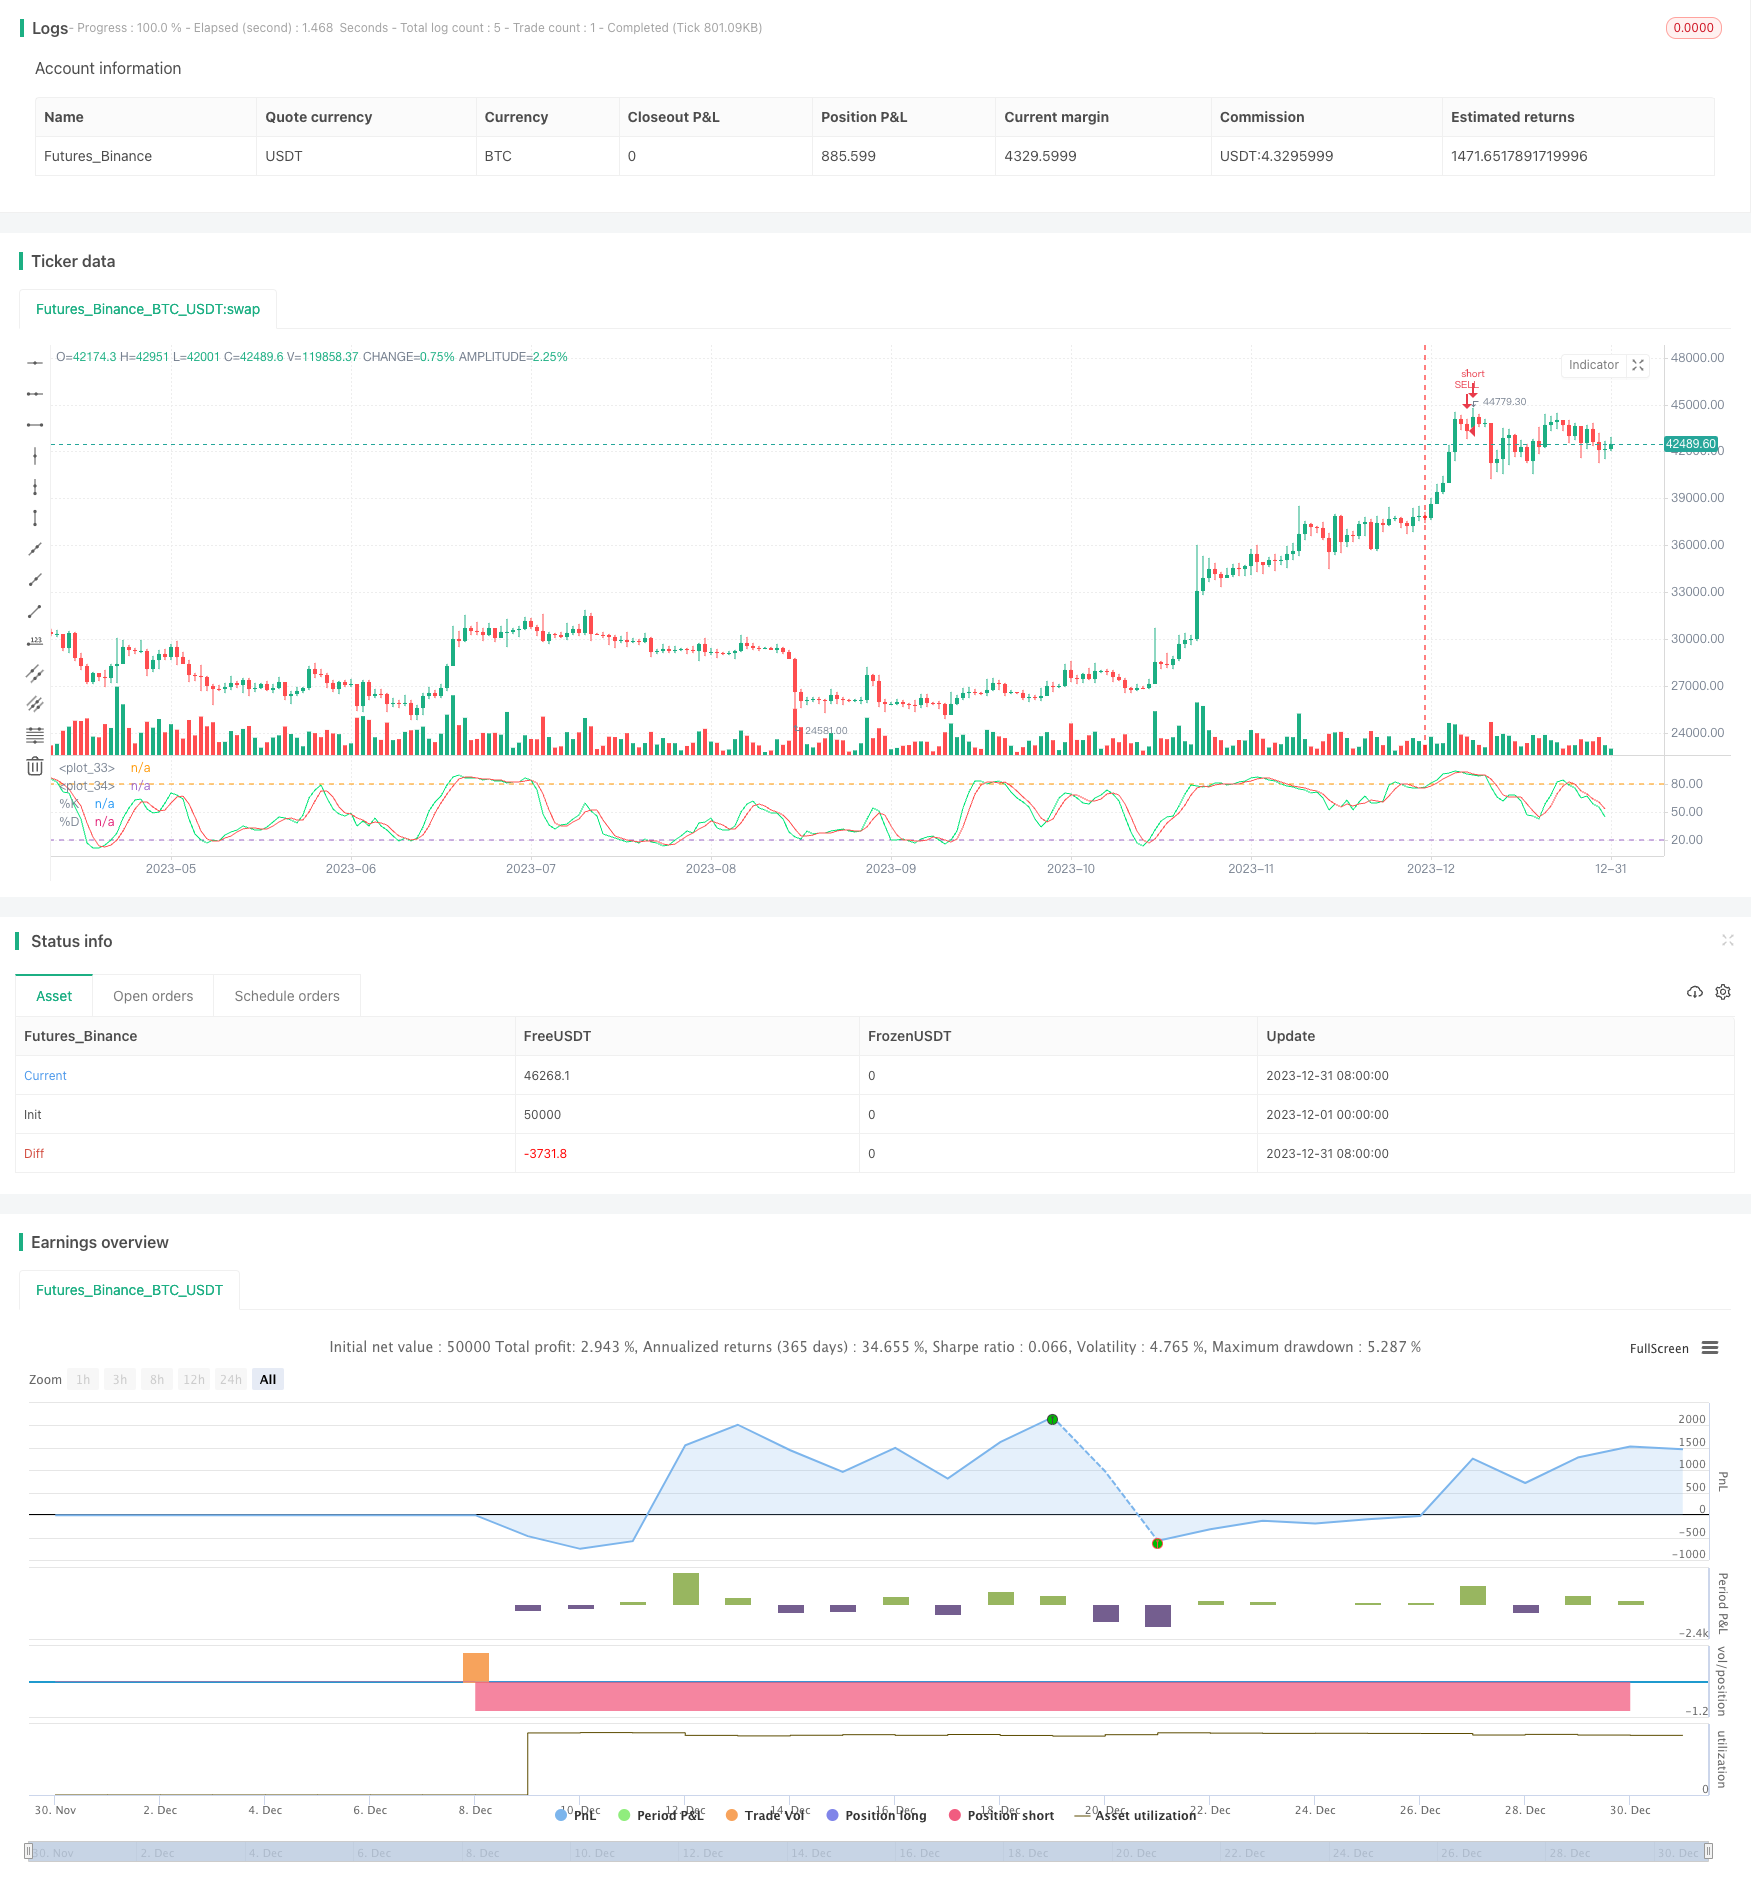
Stochastic Overlap with RSI Index Quant Trading Strategy

Author: ChaoZhang, Date: 2024-01-12 13:57:36
Tags:

img

Overview

The name of this strategy is “Stochastic Overlap with RSI Index Quant Trading Strategy”. This strategy identifies overbought and oversold situations of stocks by calculating the overlap of stochastic double moving average indicators and RSI indicators, establishes long positions when the stock is undervalued, and establishes short positions when overvalued to achieve hedging arbitrage.

Strategy Principle

The stochastic overlap with RSI index quant trading strategy judges overbought and oversold through calculating the crossover situation between %K line and %D line. Among them, the %K line is calculated as the K-day simple moving average of the closing price of the stock, and the %D line calculates the D-day simple moving average of the %K line. When the %K line crosses above the %D line from the bottom, it is considered that the stock is underestimated and a long position should be established; When the %K line crosses below the %D line from the top, it is considered that the stock is overvalued and a short position should be established.

At the same time, this strategy also combines the RSI indicator to judge the overbought and oversold conditions of stocks. The RSI indicator reflects the change in the rate of rise and fall of the stock. When the RSI is lower than 50%, it means that the stock is underestimated. When it is higher than 60%, it means that the stock is overvalued.

Combining the double moving average indicator and the RSI indicator, when the %K line crosses above the %D line from below and the RSI is less than 50%, it is determined that the stock is seriously underestimated, and a long position should be established; When the %K line crosses below the %D line from above and the RSI is higher than 60%, it is determined that the stock is seriously overvalued, and a short position should be established.

Strategy Advantages

  1. Combining double moving average indicators and RSI indicators to judge overbought and oversold avoids the error rate of single indicator judgment
  2. Flexible configuration of moving average parameters and RSI parameters to adapt to different stock characteristics
  3. Real-time monitoring of changes in the rate of rise and fall of stocks and timely adjustment of positions
  4. Can be configured for long only or short only to reduce operational risk

Strategy Risks

  1. There is a certain lag in the double moving average and RSI indicators, which may miss the best opening time
  2. In-depth research on stock characteristics is required. Improper parameter settings may lead to frequent transactions or inability to open positions
  3. Stop loss strategies need to be configured to prevent losses from expanding

Risk Mitigation Methods:

  1. Combine other indicators to avoid losses caused by price gaps
  2. Increase backtesting cycle and sample size to test stability of parameter settings
  3. Set stop loss points, increase positions and other methods to control risks

Strategy Optimization

  1. Combine trading volume indicators to avoid false breakouts
  2. Increase opening conditions to avoid excessive transaction fees due to frequent transactions
  3. Optimize position control model to increase positions under high confidence

Need to increase trading volume indicators and combine with other indicators to ensure reliability of breakthrough signals and avoid losses caused by false signals. At the same time, optimize the position control model to appropriately increase positions under high confidence to obtain higher returns.

Summary

The stochastic overlap with RSI index quant trading strategy judges the overbought and oversold conditions of stocks through the overlay use of double moving average indicators and RSI indicators, goes long when the stock is underestimated, goes short when overvalued, and achieves hedging arbitrage. This strategy makes full use of the price capturing capability of double moving average indicators and the overbought and oversold judgment capability of RSI indicators, avoiding the limitations of single indicator judgments. Through flexible parameter configuration, it can be applied to different stocks; And can be further optimized to obtain higher returns while controlling risks.


/*backtest
start: 2023-12-01 00:00:00
end: 2023-12-31 23:59:59
period: 1d
basePeriod: 1h
exchanges: [{"eid":"Futures_Binance","currency":"BTC_USDT"}]
*/

//@version=2
strategy(title="Easy to Use Stochastic + RSI Strategy", overlay=false)


//// Only Enter Long Positions /////
// strategy.risk.allow_entry_in(strategy.direction.long)


///// Backtest Start Date /////
startDate   = input(title="Start Date",   defval=1,    minval=1,    maxval=31)
startMonth  = input(title="Start Month",  defval=1,    minval=1,    maxval=12)
startYear   = input(title="Start Year",   defval=2014, minval=1800, maxval=2100)

afterStartDate = true


///// Create inputs /////
// Stochastics //
periodK = input(14, title="K", minval=1)
periodD = input(3, title="D", minval=1)
smoothK = input(3, title="Smooth", minval=1)

k = sma(stoch(close, high, low, periodK), smoothK)
d = sma(k, periodD)

// RSI Values //
rsivalue = rsi(close, 14)


///// Plot Stochastic Values and Lines /////
plot(k, title="%K", color=lime)
plot(d, title="%D", color=red)
h0 = hline(80)
h1 = hline(20)
fill(h0, h1, color=purple, transp=80)


///// Submit orders /////
if (afterStartDate and crossover(k, d) and k<20 and rsivalue<50)
    strategy.entry(id="BUY", long=true)
if (afterStartDate and crossunder(k, d) and k>80 and rsivalue>60)
    strategy.entry(id="SELL", long=false)

More