概述
本策略基于均线差值的指标,当快线上穿慢线时生成买入信号,当快线下穿慢线时生成卖出信号,属于趋势跟踪类策略。策略简单明了,容易理解,适合中短线操作。
策略原理
该策略通过计算两个不同参数的EMA均线的差值,再对这个差值计算其本身的EMA来产生交易信号。具体来说,选取周期period,计算period/2周期的2倍EMA作为快线,计算period周期EMA作为慢线,两个EMA之差构成差值diff。然后对diff再计算sqrt(period)周期的EMA,得到指标线n1。当n1上穿0轴时产生买入信号,当n1下穿0轴时产生卖出信号。这样,n1反映了差值diff的趋势方向,可以用于捕捉价格趋势。
该策略简单直接,通过双均线差值指标来判断价格趋势,属于典型的趋势跟踪策略。当价格处于趋势市场时,效果明显;当价格震荡时,则会产生多次错误信号。需要结合趋势判断和风险管理来使用。
策略优势分析
该策略具有以下优势:
策略思路简单直观,容易理解实现,适合初学者学习;
均线差值指标对价格变化敏感,可以有效捕捉趋势变化;
策略参数少,容易优化,实盘调整灵活;
可配置长短周期指标组合,适应不同市场环境;
可根据个人风险偏好配置止损策略,降低损失。
策略风险分析
该策略也存在以下风险:
震荡行情下误报率较高,需要辅助判断大级别趋势;
无法有效判断趋势反转点,存在一定的延迟;
需关注均线差值指标参数的优化,防止过于敏感或滞后;
交易次数较多,交易成本可能较高,需控制仓位规模。
对应解决方法如下:
结合长周期均线判断大趋势,避免震荡市错入;
配合其他反转指标确定买卖点,降低延迟风险;
测试参数组合,找到最佳参数;
优化止损策略,降低单笔损失。
策略优化方向
该策略可以从以下方面进行优化:
测试不同均线参数组合,找到最优参数;
增加趋势判断指标,区分趋势和震荡;
结合反转指标确定买卖点,提高精确度;
优化止损策略,降低损失。
测试不同周期参数可以提高策略 stabilit 对不同行情的适应性。增加趋势判断可以减少误报。反转指标可以提升买卖的时间点选择。这些优化都可以提高策略的稳定性和盈利能力。
总结
基于均线差值的趋势跟踪策略整体思路清晰易懂,通过双均线差值判断价格趋势方向,属于典型的趋势追踪策略。策略本身非常简单,容易实现,适合中短线操盘,特别适合初学者学习研究。但策略也存在一定风险,需要配合优化手段降低风险。如果参数优化和风险控制得当,该策略可以获得较好的效果。
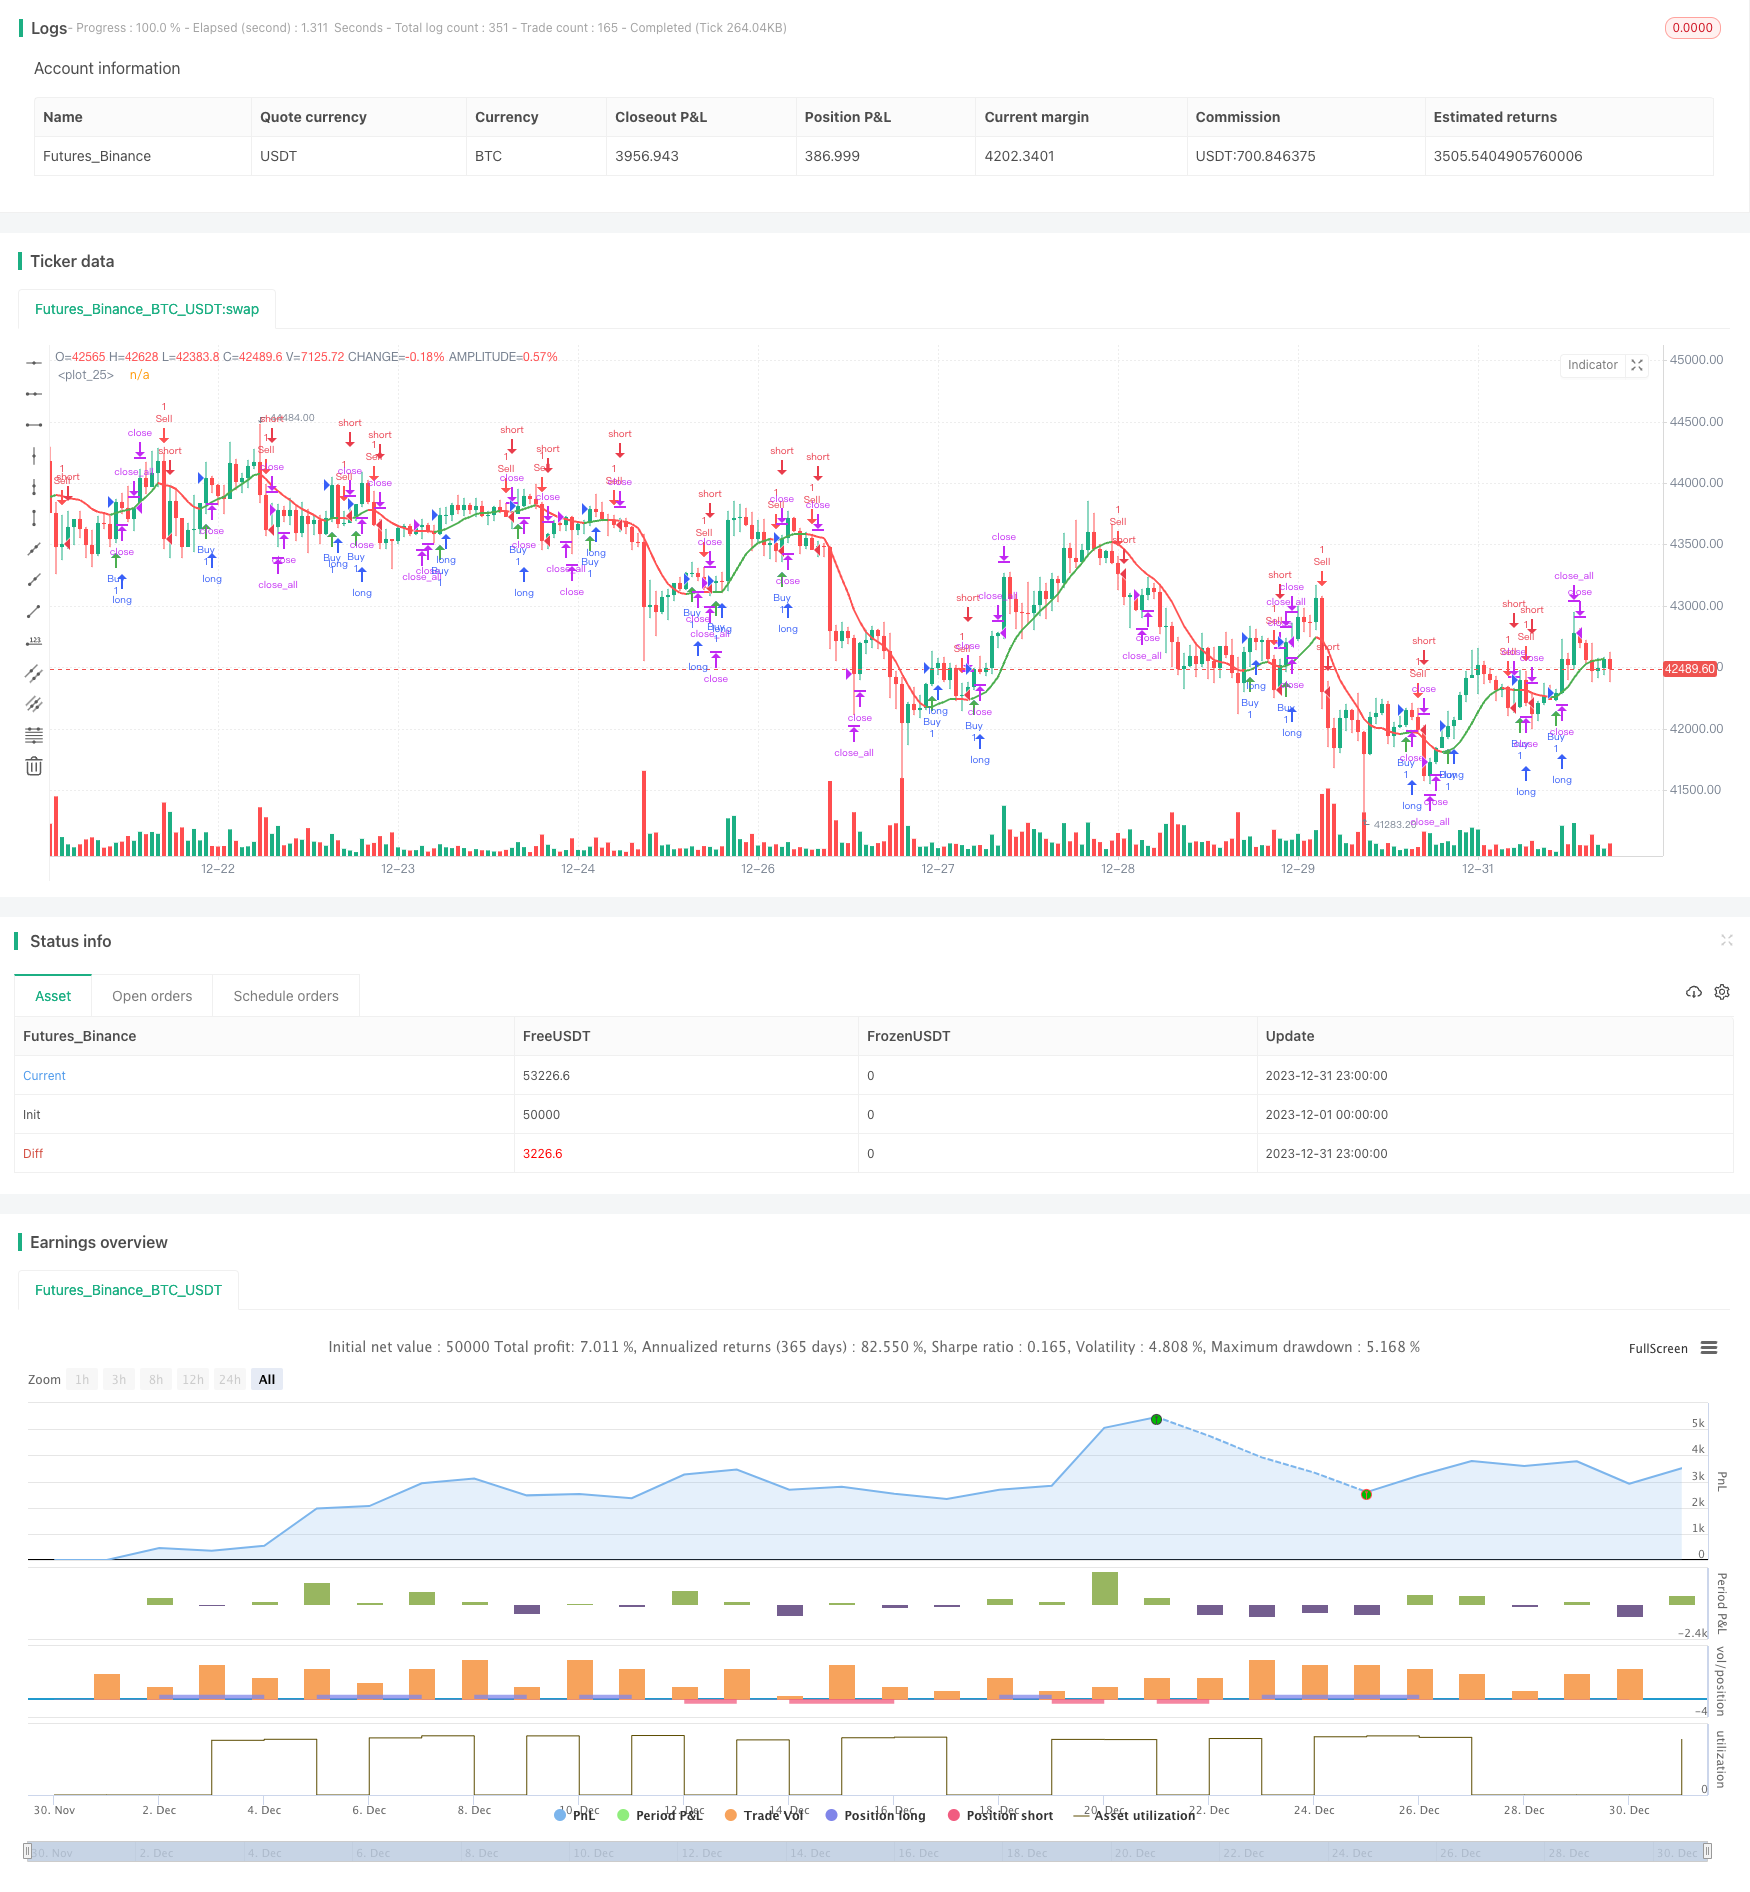
/*backtest
start: 2023-12-01 00:00:00
end: 2023-12-31 23:59:59
period: 1h
basePeriod: 15m
exchanges: [{"eid":"Futures_Binance","currency":"BTC_USDT"}]
*/

//@version=5
strategy(title='Devick', overlay=true)

// Input parameters
period = input(title='Period', defval=21)

// Calculate moving averages
n2ma = 2 * ta.ema(close, math.round(period / 2))
nma = ta.ema(close, period)
diff = n2ma - nma
sqn = math.round(math.sqrt(period))

n2maPrev = 2 * ta.ema(close[1], math.round(period / 2))
nmaPrev = ta.ema(close[1], period)
diffPrev = n2maPrev - nmaPrev
sqnPrev = math.round(math.sqrt(period))

n1 = ta.ema(diff, sqn)
n2 = ta.ema(diffPrev, sqnPrev)

// Determine color based on condition
maColor = n1 > n2 ? color.green : color.red

// Plot moving average
ma = plot(n1, color=maColor, linewidth=2)

// Signals
buySignal = n1 > n2 and n1[1] <= n2[1]
sellSignal = n1 <= n2 and n1[1] > n2[1]

// Plot shapes for signals
plotshape(series=buySignal, title='Buy Signal', style=shape.arrowup, location=location.belowbar, color=color.green, size=size.small)
plotshape(series=sellSignal, title='Sell Signal', style=shape.arrowdown, location=location.abovebar, color=color.red, size=size.small)

// Alerts
alertcondition(condition=buySignal, title='Buy Signal', message='Buy Signal Detected')
alertcondition(condition=sellSignal, title='Sell Signal', message='Sell Signal Detected')

// Trading hours
openHour = 16
closeHour = 17

// Open position at 4 pm
openCondition = hour == openHour and minute == 0
strategy.entry("Buy", strategy.long, when=buySignal)
strategy.entry("Sell", strategy.short, when=sellSignal)
// Close all positions at 5 pm
closeCondition = hour == closeHour and minute == 0
strategy.close_all(when=closeCondition)