概述
本策略基于双EMA指标和AC加速振荡指标设计。其中,双EMA指标用于判断价格趋势方向,而AC指标则用于确认趋势信号,实现过滤效果。该策略结合了趋势跟踪和信号过滤两大功能,旨在提高信号质量,在趋势中获利。
策略原理
该策略由两大模块组成:
双EMA模块
使用2日EMA和20日EMA构建双EMA指标。当价格上穿2日EMA时视为买入信号;当价格下破20日EMA时视为卖出信号。
该模块判断价格的短期和中期趋势方向,实现基本的趋势跟踪。
AC模块
使用AC加速振荡指标的正负值来确认趋势信号。只有当双EMA和AC指标同方向时,才产生交易信号。
该模块通过过滤假信号,提高了信号的可靠性。
综上,该策略整合双EMA判断大趋势,以及AC指标过滤假突破,形成系统性的趋势跟踪体系。
策略优势分析
本策略具有如下优势:
双EMA跟踪中长线趋势,AC滤除短期噪音,组合效果好。
信号过滤效果佳,可避免多头获利后盲目做空,或空头获利后盲目做多的情况。
调参数灵活,可配合不同品种和市场环境调整参数,适用面广。
策略思路清晰,容易理解,便于量化交易者优化和改进。
可在趋势型品种中获得不错的跟踪获利。
策略风险分析
本策略也存在一些风险:
双EMA参数设置不当可能错过较短的趋势或者产生多余交易。
AC参数设置不当可能过滤掉较弱的有效信号或者无法过滤足够的噪音。
无法应对急速变化的市场,如快速断崖式下跌。
无法在震荡市中获得足够盈利,应作为趋势跟踪策略使用。
策略优化方向
本策略可从以下维度进行优化:
测试更多参数组合,寻找更匹配不同品种特点的最优参数。
增加止损模块,在亏损过大时止损退出。
结合更多指标进行信号过滤优化。
开发长短线组合策略,在趋势中跟踪中长线,利用短线针对性交易为长线减仓加仓。
总结
本策略结合双EMA判趋势和AC滤噪的思路值得学习借鉴。该策略优势在于信号质量好,可靠性高,适合跟踪趋势型品种。如果参数调整合适,在趋势行情中可获得丰厚收益。
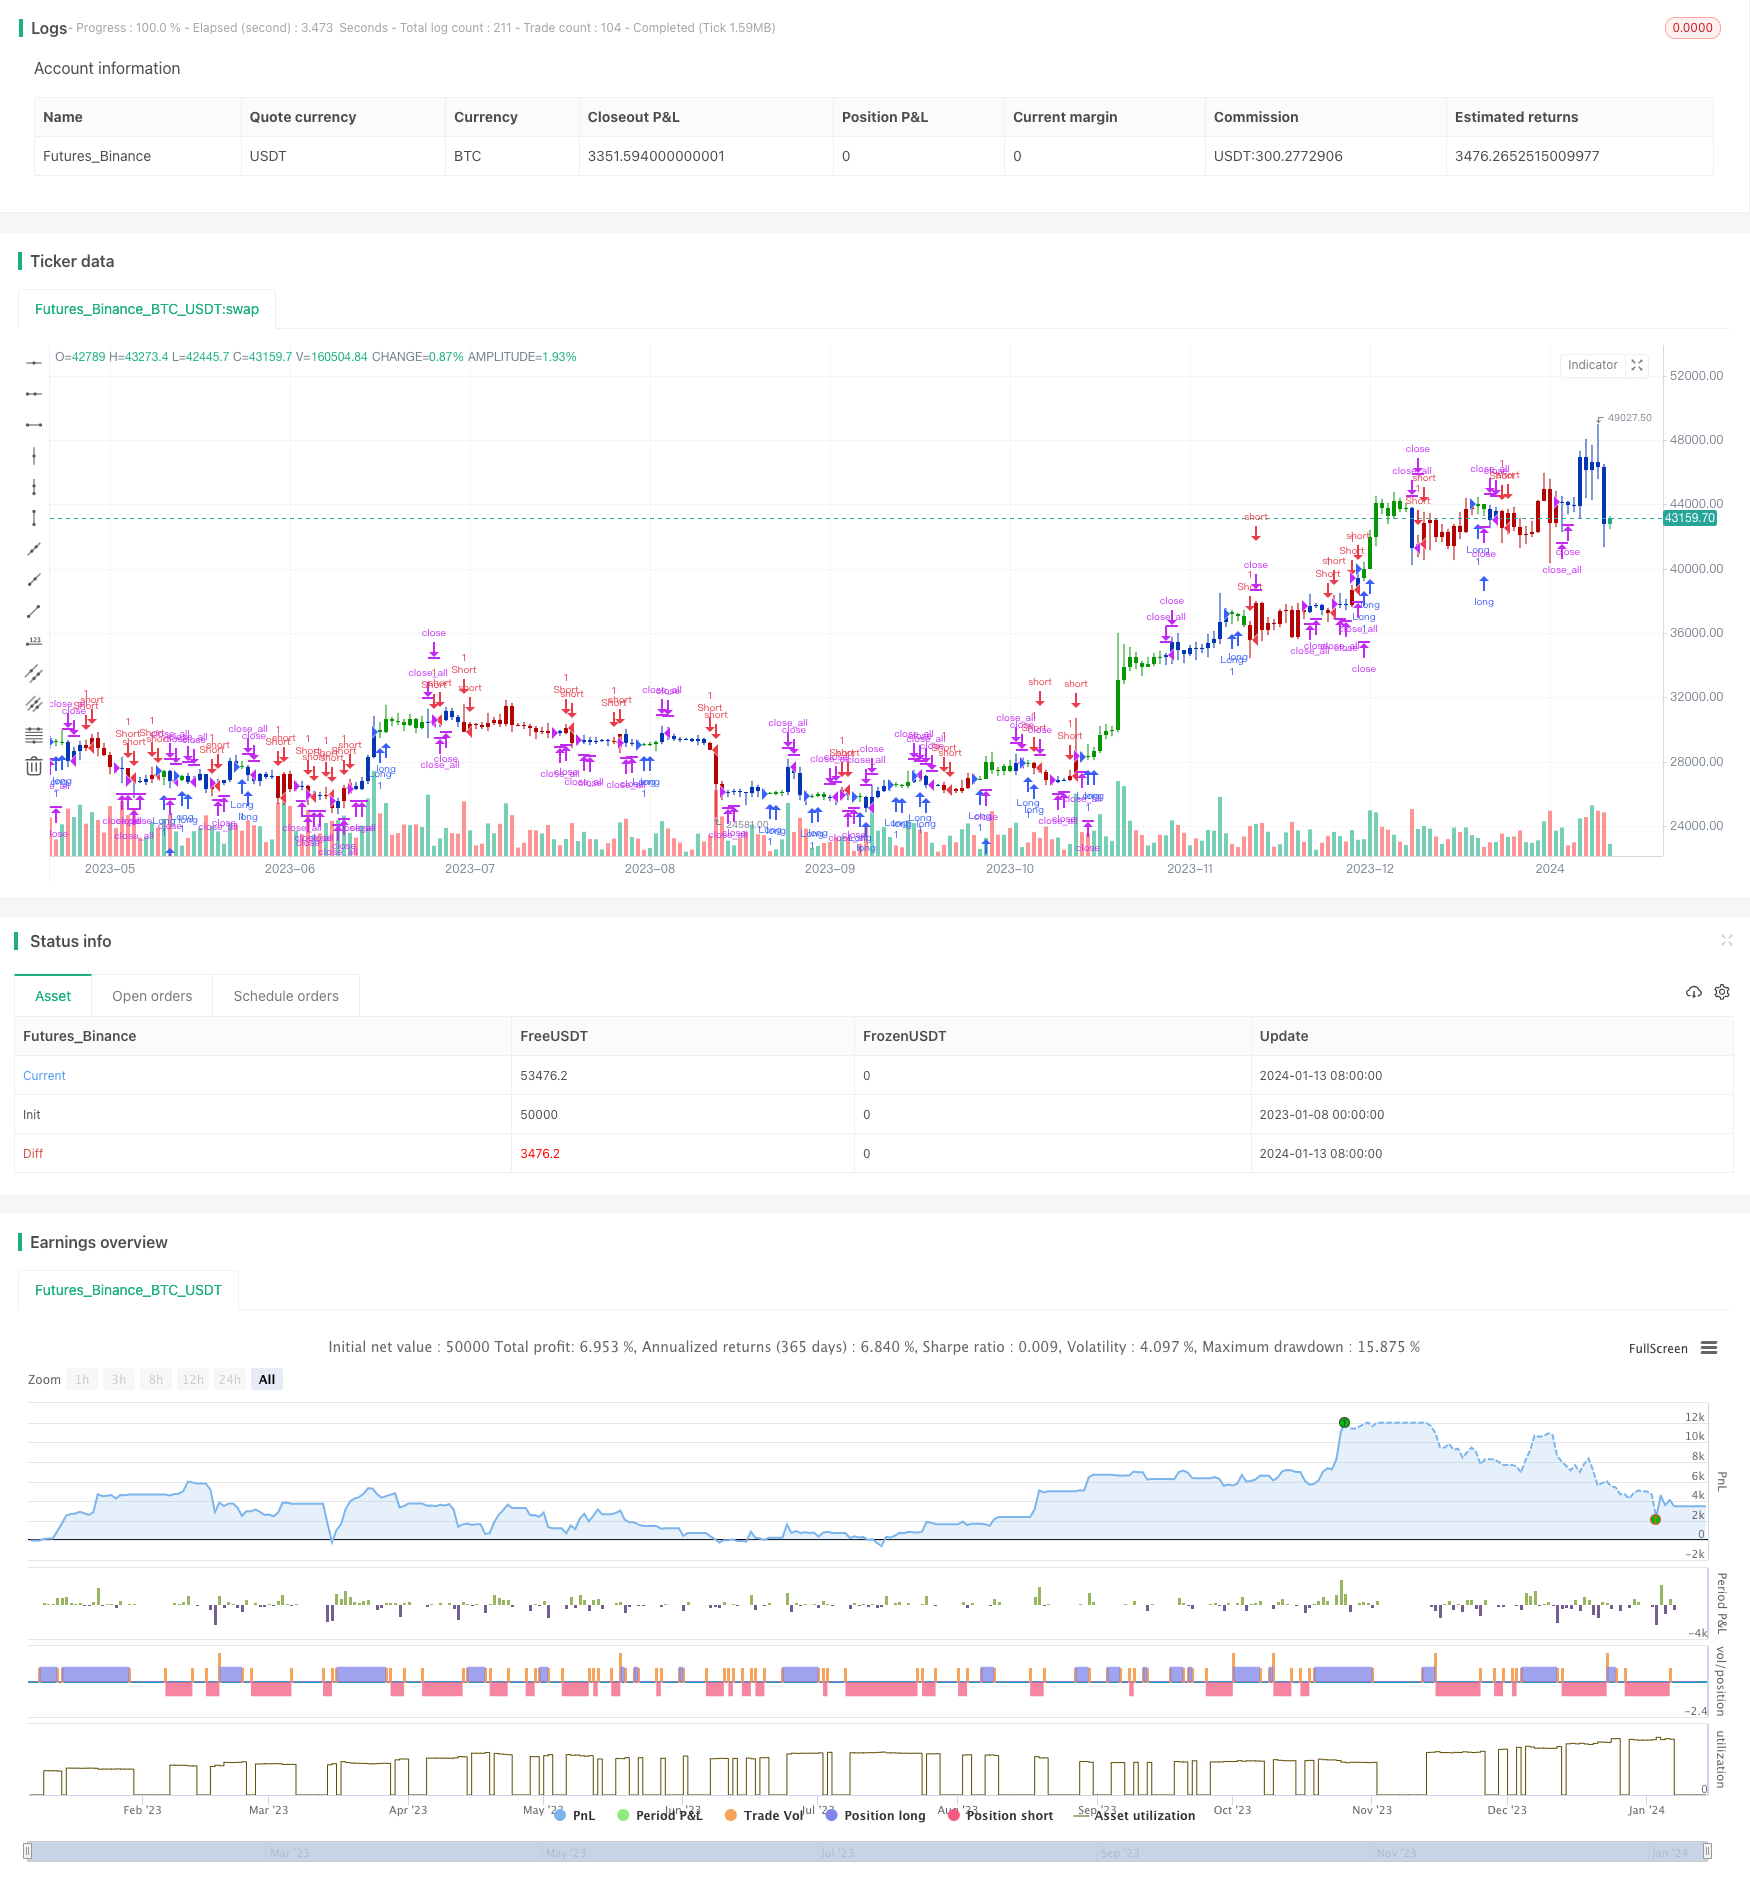
/*backtest
start: 2023-01-08 00:00:00
end: 2024-01-14 00:00:00
period: 1d
basePeriod: 1h
exchanges: [{"eid":"Futures_Binance","currency":"BTC_USDT"}]
*/

//@version=5
////////////////////////////////////////////////////////////
//  Copyright by HPotter v1.0 19/01/2022
// This is combo strategies for get a cumulative signal.
//
// First strategy
// This indicator plots 2/20 exponential moving average. For the Mov
// Avg X 2/20 Indicator, the EMA bar will be painted when the Alert criteria is met.
//
// Second strategy
// The Accelerator Oscillator has been developed by Bill Williams
// as the development of the Awesome Oscillator. It represents the
// difference between the Awesome Oscillator and the 5-period moving
// average, and as such it shows the speed of change of the Awesome
// Oscillator, which can be useful to find trend reversals before the
// Awesome Oscillator does.
//
// WARNING:
// - For purpose educate only
// - This script to change bars colors.
////////////////////////////////////////////////////////////
EMA20(Length) =>
    pos = 0.0
    xPrice = close
    xXA = ta.ema(xPrice, Length)
    nHH = math.max(high, high[1])
    nLL = math.min(low, low[1])
    nXS = nLL > xXA or nHH < xXA ? nLL : nHH
    iff_1 = nXS < close[1] ? 1 : nz(pos[1], 0)
    pos := nXS > close[1] ? -1 : iff_1
    pos

AC(nLengthSlow,nLengthFast) =>
    pos = 0.0
    xSMA1_hl2 = ta.sma(hl2, nLengthFast)
    xSMA2_hl2 = ta.sma(hl2, nLengthSlow)
    xSMA1_SMA2 = xSMA1_hl2 - xSMA2_hl2
    xSMA_hl2 = ta.sma(xSMA1_SMA2, nLengthFast)
    nRes =  xSMA1_SMA2 - xSMA_hl2
    cClr = nRes > nRes[1] ? color.blue : color.red
    iff_1 = nRes > 0 ? 1 : nz(pos[1], 0)
    pos := nRes < 0 ? -1 : iff_1
    pos

strategy(title='Combo 2/20 EMA & Accelerator Oscillator (AC)', shorttitle='Combo', overlay=true)
var I1 = '●═════ 2/20 EMA ═════●'
Length = input.int(14, minval=1, group=I1)
var I2 = '●═════ Accelerator Oscillator  ═════●'
nLengthSlow = input(33,  title="Length Slow", group=I2)
nLengthFast = input(6, title="Length Fast", group=I2)
var misc = '●═════ MISC ═════●'
reverse = input.bool(false, title='Trade reverse', group=misc)
var timePeriodHeader = '●═════ Time Start ═════●'
d = input.int(1, title='From Day', minval=1, maxval=31, group=timePeriodHeader)
m = input.int(1, title='From Month', minval=1, maxval=12, group=timePeriodHeader)
y = input.int(2005, title='From Year', minval=0, group=timePeriodHeader)

StartTrade = time > timestamp(y, m, d, 00, 00) ? true : false
posEMA20 = EMA20(Length)
prePosAC = AC(nLengthSlow,nLengthFast)
iff_1 = posEMA20 == -1 and prePosAC == -1 and StartTrade ? -1 : 0
pos = posEMA20 == 1 and prePosAC == 1 and StartTrade ? 1 : iff_1
iff_2 = reverse and pos == -1 ? 1 : pos
possig = reverse and pos == 1 ? -1 : iff_2
if possig == 1
    strategy.entry('Long', strategy.long)
if possig == -1
    strategy.entry('Short', strategy.short)
if possig == 0
    strategy.close_all()
barcolor(possig == -1 ? #b50404 : possig == 1 ? #079605 : #0536b3)