RSI Bullish and Bearish Divergence Trading Strategy

Overview
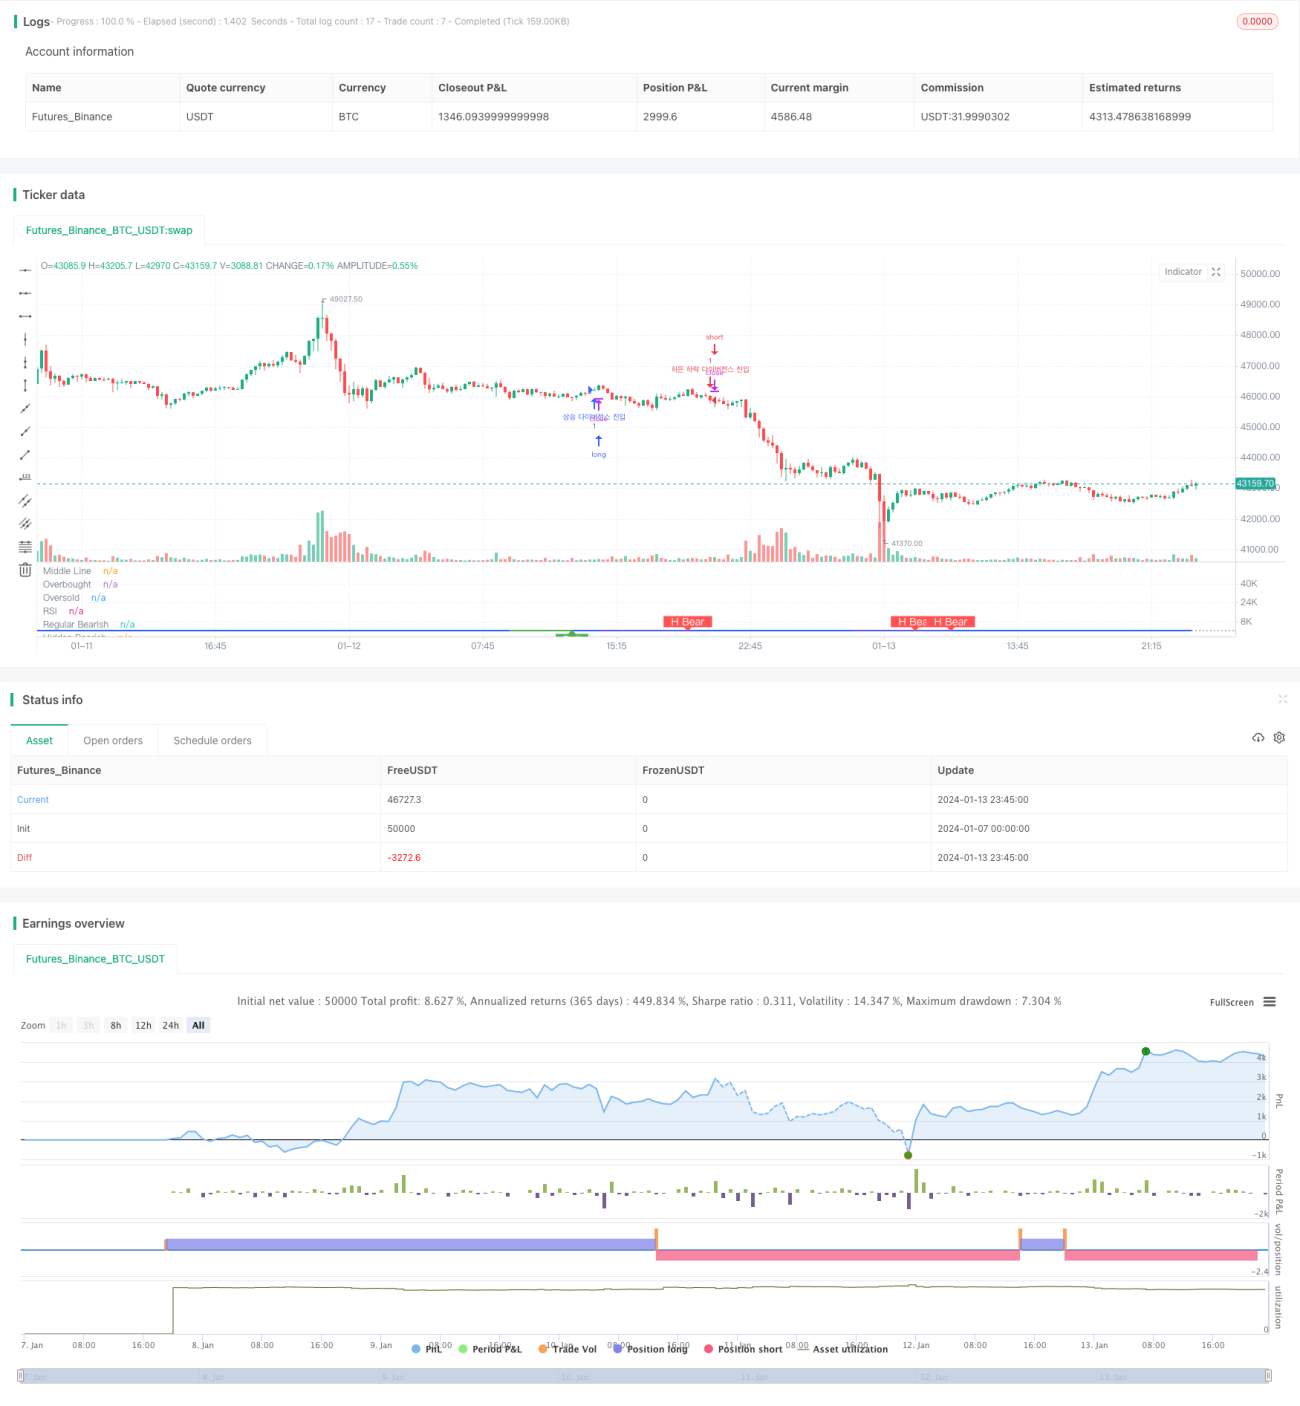
This strategy judges the bullish and bearish trends of the market and makes trading decisions by calculating the divergence of RSI indicator. Specifically, it will judge hidden bullish signals when RSI forms lower lows but prices form higher lows. And it will judge hidden bearish signals when RSI forms higher highs but prices form lower highs. Then it determines the potential bullish or bearish trends of the market based on these signals and makes trades.
Strategy Logic
The strategy is mainly based on the bullish and bearish divergence theory of RSI indicator. When RSI and price form reverse divergences, it indicates potential reversals of the market. There are four specific situations:
-
Regular Bullish Signal: RSI forms higher low while price forms lower low. It indicates the buying power pushes up the RSI but not fully reflects on the price, implying strengthened bullish power.
-
Hidden Bullish Signal: RSI forms lower low while price forms higher low. It implies the selling power pushes down the RSI but not the price, indicating strengthened bullish power.
-
Regular Bearish Signal: RSI forms lower high while price forms higher high. It implies the selling power pushes up the price but not RSI, indicating strengthened bearish power.
-
Hidden Bearish Signal: RSI forms higher high while price forms lower high. It indicates buying power pushes up RSI but not price, implying strengthened bearish power.
Based on the above divergences, it judges the potential bullish or bearish trends of the market and the strengthening of buying/selling power to formulate trading strategies.
Advantages
- Utilize the bullish and bearish divergence theory of RSI to determine the potential trends of market.
- Also combine price actions to confirm, avoiding noisy signals.
- Able to capture critical signals before fast reversals of market.
- Implement visualized indication for bullish and bearish signals, easy and intuitive to operate.
- Customizable parameters fitting different market environments.
Risks
- Divergences between RSI and price may not necessarily imply reversals, could just be range-bound actions.
- Hidden signals have relatively larger noise, risks of misjudgement.
- Need to incorporate more indicators or technical analysis methods to confirm the signals.
- Improper parameter settings may also affect the judgements.
Enhancement Directions
- Incorporate MACD, KDJ and other indicators with RSI to determine entry signals.
- Add stop loss strategy to reduce losses per trade.
- Optimize parameter settings like searching for more suitable RSI periods.
- Introduce machine learning algorithms to train the accuracy of capturing entry signals.
- Implement websocket for real-time quotes to reduce signal confirmation latency.
Summary
The strategy mainly leverages the bullish and bearish divergences of RSI to determine the potential bullish or bearish trends of market by capturing the relative strength changes between buying and selling power behind the price actions. It has certain predictive capabilities of reversals. But it also has risks of noisy signals. Ways like parameter optimization, indicator combination, machine learning can help further enhance the stability and profitability of the strategy.
/*backtest
start: 2024-01-07 00:00:00
end: 2024-01-14 00:00:00
period: 15m
basePeriod: 5m
exchanges: [{"eid":"Futures_Binance","currency":"BTC_USDT"}]
*/

//@version=5
strategy(title="Divergence Indicator")
len = input.int(title="RSI Period", minval=1, defval=20)
src = input(title="RSI Source", defval=close)- 1