概述
本策略名称为“量化交易双重指标策略”。该策略同时利用布林带指标和相对强弱指标两个指标作为交易信号,实现了一种双重指标过滤的交易策略。
策略原理
本策略的核心逻辑是同时利用布林带和RSI两个指标判断市场的超买超卖情况,进行交易信号过滤。
具体来说,布林带的上轨和下轨可以判断价格是否处于波动范围之外,从而判断市场是否超买或超卖。相对强弱指标RSI则可以判断市场力量的强弱,RSI高于55时为超买信号,低于45时为超卖信号。
本策略设置为,仅当布林带指标和RSI指标同时显示超买或超卖信号时,才会进行相应的买入或卖出操作。这样可以过滤掉部分误导性信号,提高策略稳定性。
策略优势
本策略最大的优势在于利用双重指标进行过滤,可以减少误导性交易,提高信号的可靠性。
相比单一布林带指标,双重指标策略可以大幅度降低假信号的概率。相比单一RSI指标,则可以利用布林带判断目前是否处于震荡区间之外,防止在震荡市场中产生错误信号。
整体来说,双重指标策略综合考虑了多种情况,适应性和稳定性都较好。
策略风险和解决方法
本策略的主要风险在于布林带参数设置和RSI参数设置都可能不当。如果布林带参数设置得过于敏感,容易产生多余信号;如果RSI参数设置得过于宽松,效果减弱。
此外,双重指标组合本身就意味着信号会更少。如果市场只符合一个指标的信号而另一个指标未达到触发水平,那么本策略就不会产生信号。因此相比单一指标策略,本策略的交易频率会更低。
解决方法主要有设置更加恰当的参数,修改RSI和布林带的触发水平等。如果交易频率过低,可以考虑降低参数要求,提高入场机会。
策略优化方向
本策略可以从以下几个方向进行优化:
测试不同的布林带参数和RSI参数组合,寻找更匹配的组合。现有参数可能并不完全适合所有品种和时间段。
增加止损止盈策略,提高盈利结果。当前的策略没有这些方面的考虑。
增加仓位管理机制。使用动态仓位可以在走势好的时候加大头寸,在走势差时减少亏损。
增加基于历史数据的参数自适应功能。让指标参数可以自动优化,适应最新市况。
总结
本策略作为一种双重指标过滤的策略,总体稳定性和适应性较好。它在降低假信号比例的同时,也降低了交易频率。通过优化指标参数和增加辅助功能,可以进一步增强策略的盈利空间。
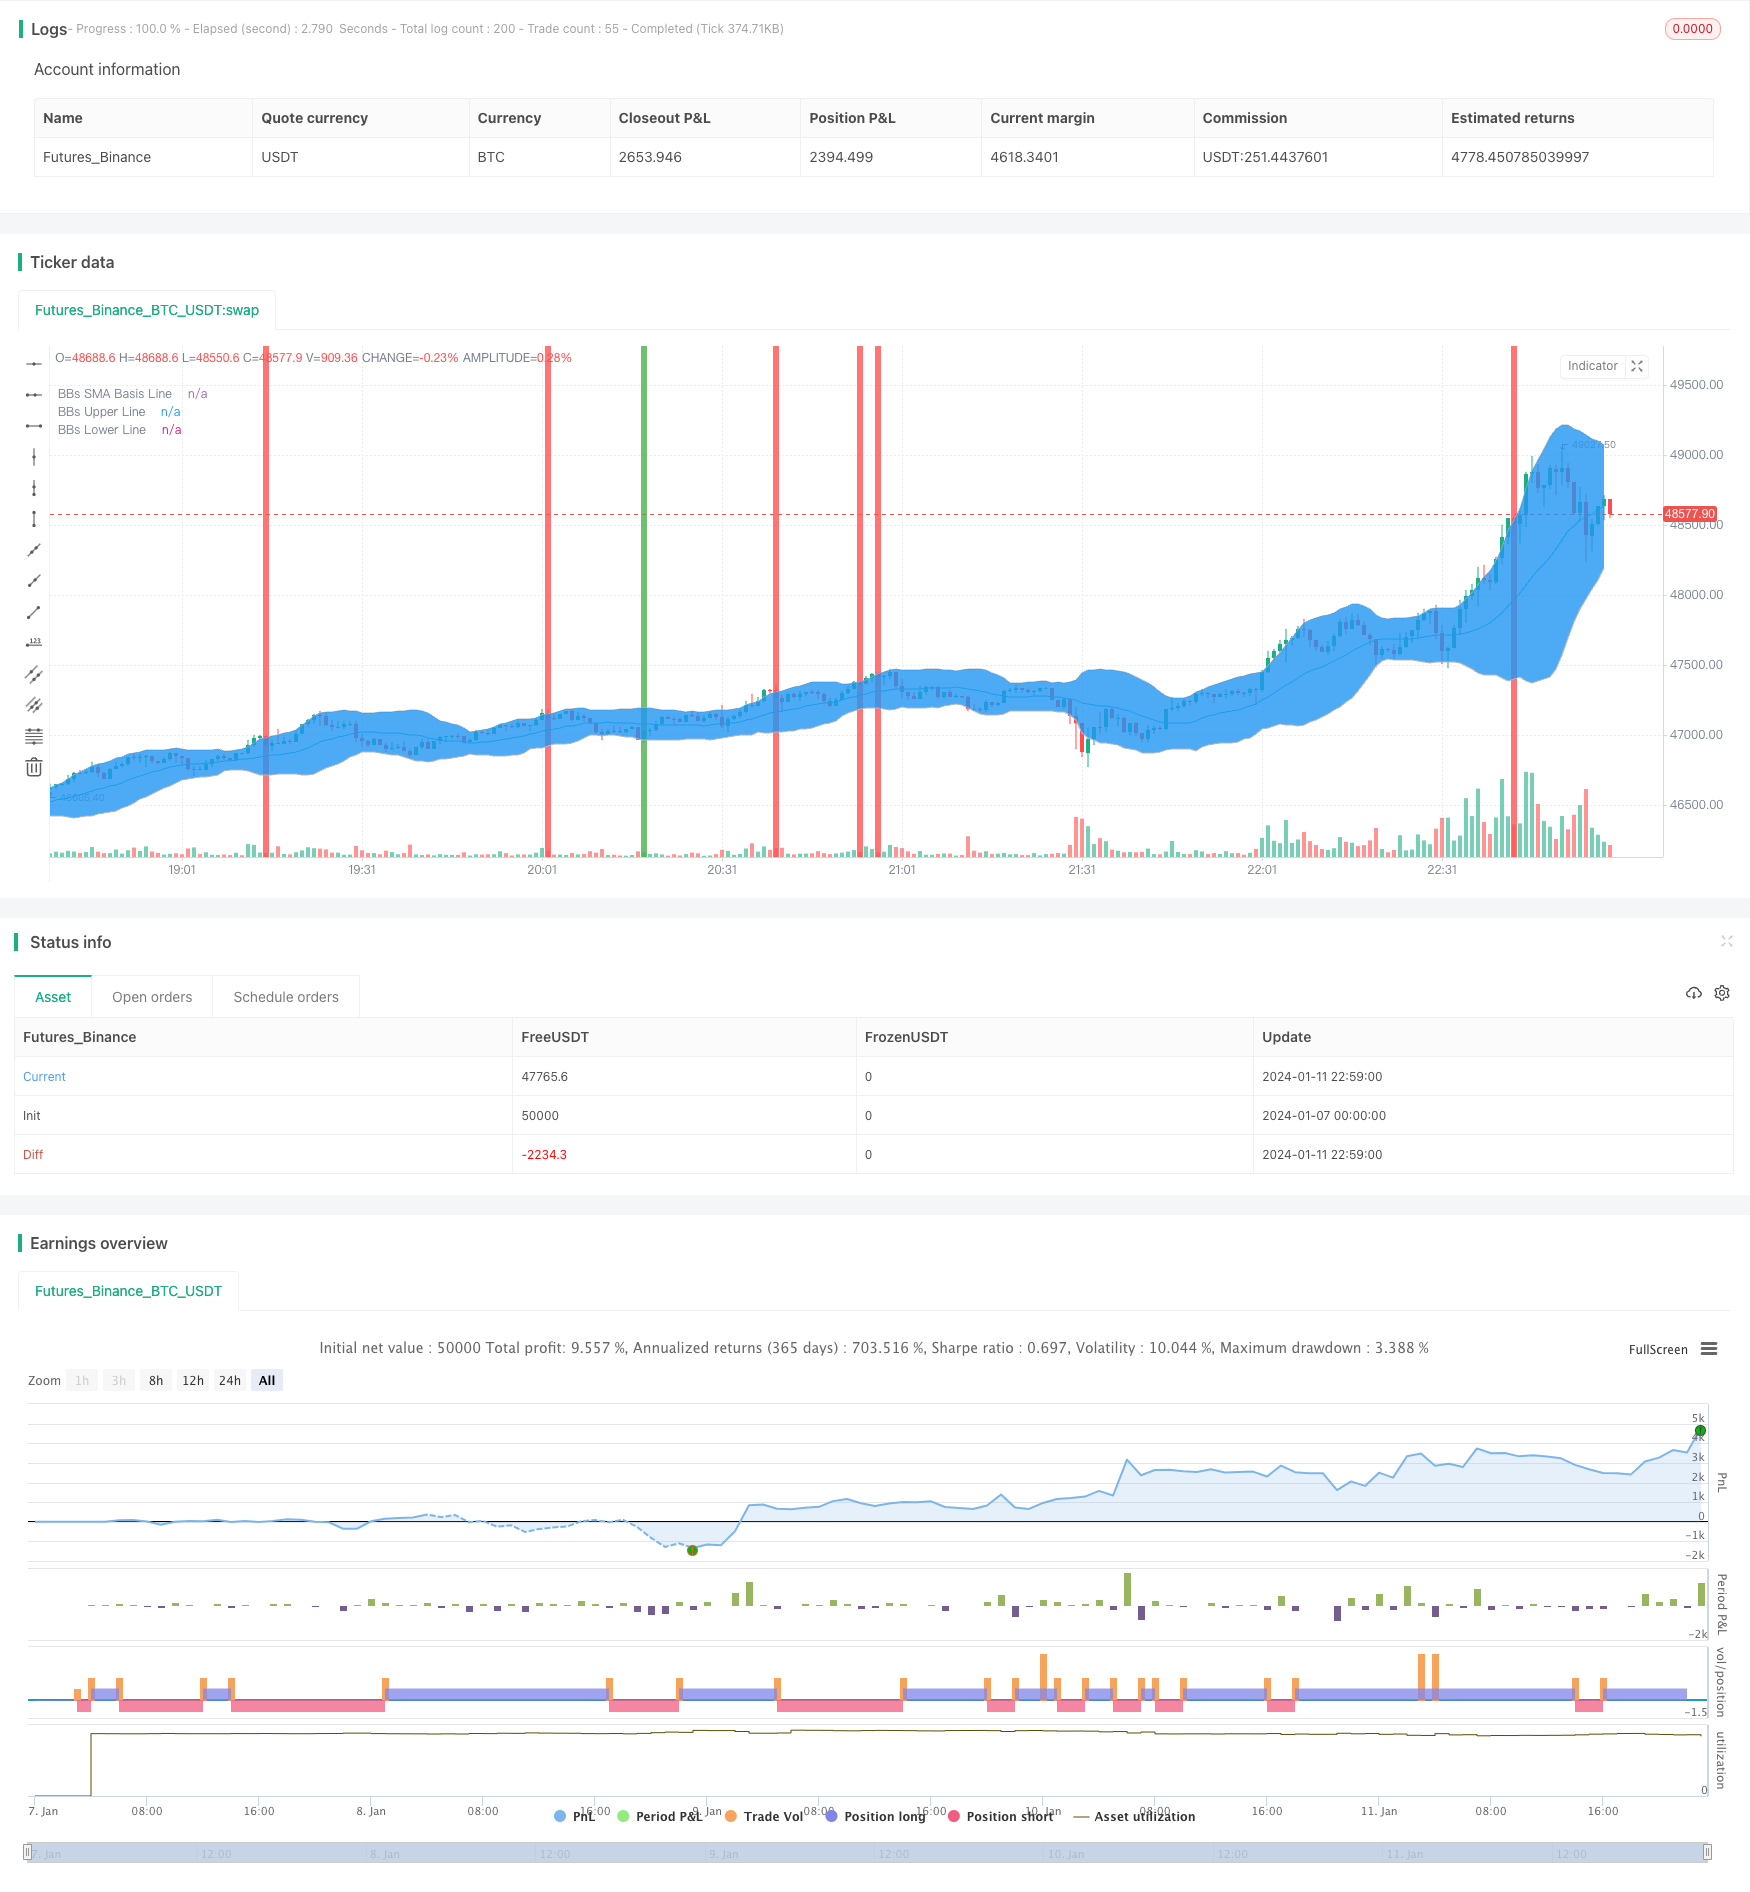
/*backtest
start: 2024-01-07 00:00:00
end: 2024-01-11 23:00:00
period: 1m
basePeriod: 1m
exchanges: [{"eid":"Futures_Binance","currency":"BTC_USDT"}]
*/

//@version=2
strategy("Bollinger Bands + RSI, Double Strategy (by SlumdogTrader)", shorttitle="BolBand_RSI_Strat", overlay=true)

// SlumdogTrader's Bollinger Bands + RSI Double Strategy - Profit Trailer
//
// Version 1.0
// Script by SlumdogTrader on July Fri 13(!), 2018.
//
// This strategy uses a normalise Bollinger Bands + RSI.
//
// Bollinger Band triggers
// SELL - when the price is above the upper band.
// BUY - when the price is below the lower band.
//
// RSI triggers
// SELL - when the price is above 55.
// BUY - when the price is below 45.
//
// This simple strategy only triggers when
// both the BB and the RSI
// indicators, at the same time, are in
// a overbought or oversold condition.
//
// Visit my TradingView work at:
// https://www.tradingview.com/u/SlumdogTrader/
//
// Visit my website at:
// https://www.slumdogtrader.com
//

///////////// Bollinger Bands Settings
BBlength = input(20, minval=1,title="Bollinger Bands SMA Period Length")
BBmult = input(2.0, minval=0.001, maxval=50,title="Bollinger Bands Standard Deviation")
price = input(close, title="Source")
BBbasis = sma(price, BBlength)
BBdev = BBmult * stdev(price, BBlength)
BBupper = BBbasis + BBdev
BBlower = BBbasis - BBdev
source = close
buyEntry = crossover(source, BBlower)
sellEntry = crossunder(source, BBupper)
plot(BBbasis, color=aqua,title="BBs SMA Basis Line")
p1 = plot(BBupper, color=silver,title="BBs Upper Line")
p2 = plot(BBlower, color=silver,title="BBs Lower Line")
fill(p1, p2)

///////////// RSI Settings
RSIlength = input( 16 ,title="RSI Period Length")
RSIvalue = input( 45 ,title="RSI Value Range")
RSIoverSold = 0 + RSIvalue
RSIoverBought = 100 - RSIvalue
vrsi = rsi(price, RSIlength)


///////////// Colour Settings
switch1=input(true, title="Enable Bar Color?")
switch2=input(true, title="Enable Background Color?")
TrendColor = RSIoverBought and (price[1] > BBupper and price < BBupper) ? red : RSIoverSold and (price[1] < BBlower and price > BBlower)  ? green : na
barcolor(switch1?TrendColor:na)
bgcolor(switch2?TrendColor:na,transp=50)


///////////// RSI + Bollinger Bands Strategy
if (not na(vrsi))

    if (crossover(vrsi, RSIoverSold) and crossover(source, BBlower))
        strategy.entry("RSI_BB_L", strategy.long, stop=BBlower,  comment="RSI_BB_L")
    else
        strategy.cancel(id="RSI_BB_L")

    if (crossunder(vrsi, RSIoverBought) and crossunder(source, BBupper))
        strategy.entry("RSI_BB_S", strategy.short, stop=BBupper,  comment="RSI_BB_S")
    else
        strategy.cancel(id="RSI_BB_S")

//plot(strategy.equity, title="equity", color=red, linewidth=2, style=areabr)