概述
双均线反转交易策略通过结合布林线反转交易策略和双指数移动平均线交易策略,设计出一个综合信号判断的交易策略。它可以在股票、外汇、加密货币等市场中使用。
策略原理
该策略由两部分组成:
布林线反转交易策略
使用布林线指标中的两个线 - %K线和%D线。当收盘价连续两天低于前一日,而%K线高于%D线时做多;当收盘价连续两天高于前一日,而%K线低于%D线时做空。
双指数移动平均线策略
计算20日和20日*2的双指数移动平均线。当价格从上方下穿或下方上穿双指数移动平均线时,产生交易信号。
综合信号判断规则:当两种策略的交易信号一致时,产生实际的交易信号。
优势分析
这种组合策略最大的优势在于可靠性高,虚假信号很少。因为它需要两种不同类型策略的信号同时触发,过滤掉了一些单一策略中可能出现的错误信号。
另外,由于结合了反转策略和趋势策略,它可以抓住标的证券价格的短期反转和中期趋势。
风险分析
该策略的主要风险在于,当市场长期处于震荡调整时,两种策略可能无法产生一致信号,从而导致无效的市场状态。这时,交易者需要暂停使用该策略,等待明确趋势形成。
另外,双指数移动平均线作为中长线指标,当短线快速反转时也可能失败。这需要交易者结合更多指标判断大盘走势。
优化方向
该策略可以从以下几个方面进行优化:
添加更多参数,如止损点位、移动止损幅度等,使策略更加可控。
加入更多指标,形成多重过滤条件,排除更多噪音交易。比如结合MACD、KD等其他指标。
优化指标参数,如布林线周期、移动平均线周期等参数的调整,寻找最佳参数组合。
分别测试该策略在不同品种(股票、外汇、加密货币等)中的效果,选择最佳适用品种。
总结
双均线反转策略通过组合使用反转策略和趋势策略,形成比较可靠的综合交易信号。它适用于对证券价格短期反转和中期趋势都感兴趣的交易者。但需要注意在长期震荡行情中该策略可能失效。通过优化参数以及加入更多指标可以进一步增强该策略的实用性。
/*backtest
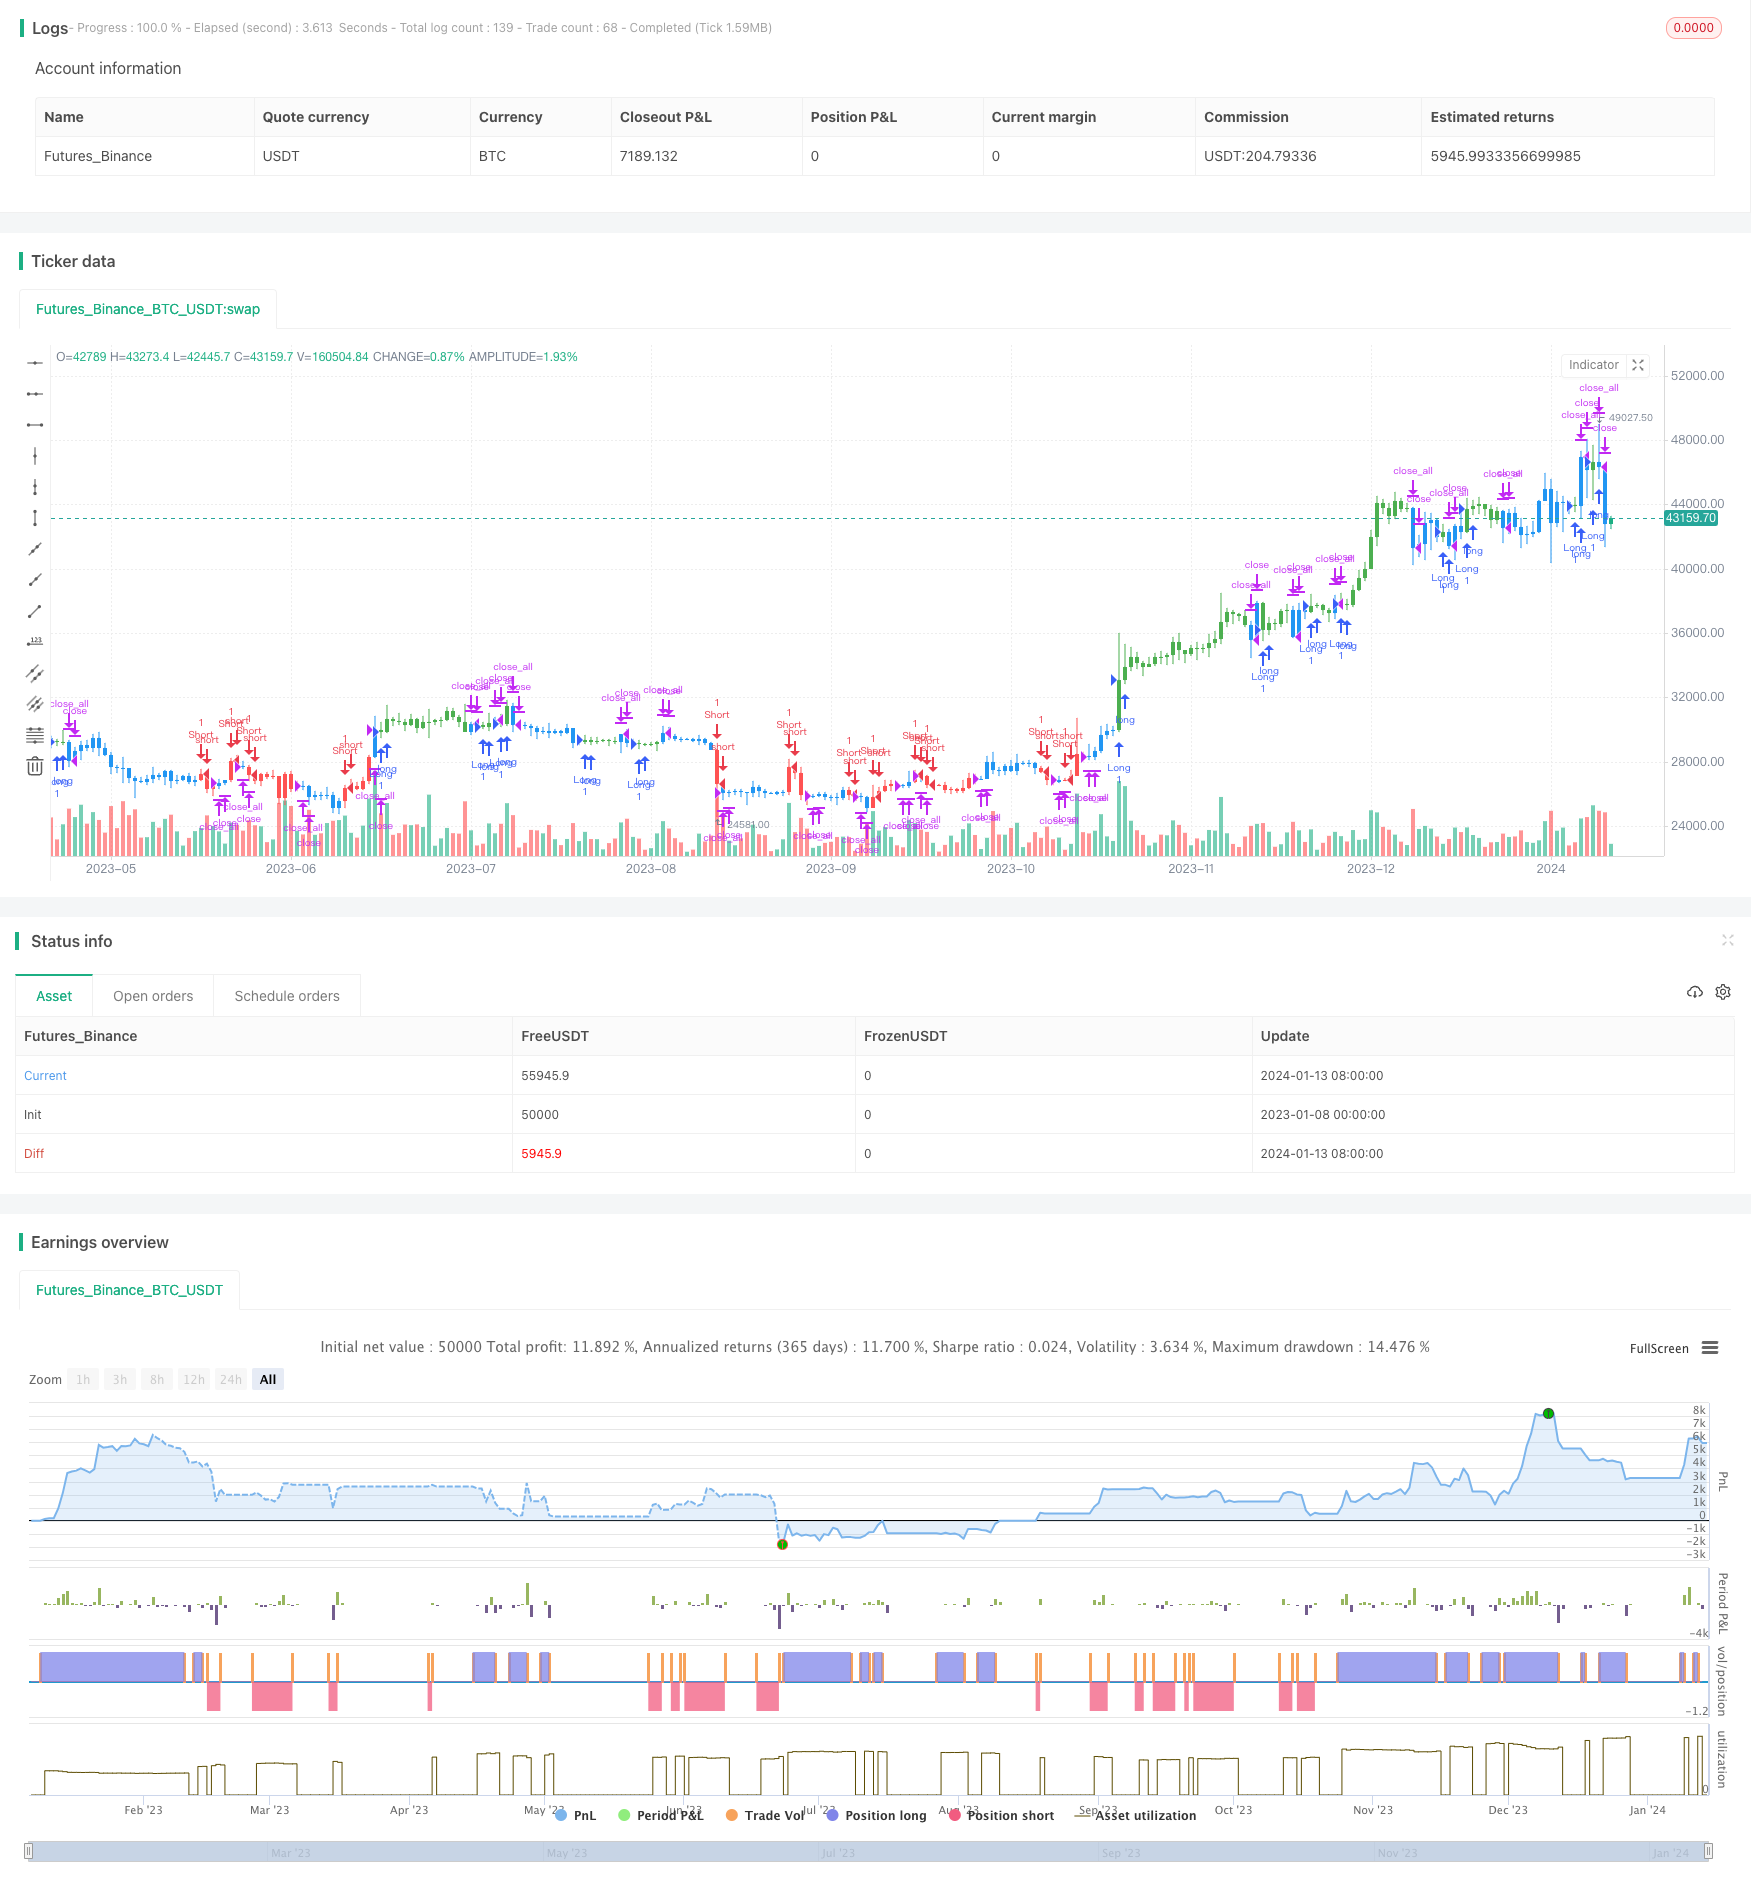
start: 2023-01-08 00:00:00
end: 2024-01-14 00:00:00
period: 1d
basePeriod: 1h
exchanges: [{"eid":"Futures_Binance","currency":"BTC_USDT"}]
*/
//@version=3
////////////////////////////////////////////////////////////
// Copyright by HPotter v1.0 12/04/2019
// This is combo strategies for get
// a cumulative signal. Result signal will return 1 if two strategies
// is long, -1 if all strategies is short and 0 if signals of strategies is not equal.
//
// First strategy
// This System was created from the Book "How I Tripled My Money In The
// Futures Market" by Ulf Jensen, Page 183. This is reverse type of strategies.
// The strategy buys at market, if close price is higher than the previous close
// during 2 days and the meaning of 9-days Stochastic Slow Oscillator is lower than 50.
// The strategy sells at market, if close price is lower than the previous close price
// during 2 days and the meaning of 9-days Stochastic Fast Oscillator is higher than 50.
//
// Secon strategy
// This indicator plots 2/20 exponential moving average. For the Mov
// Avg X 2/20 Indicator, the EMA bar will be painted when the Alert criteria is met.
// Please, use it only for learning or paper trading. Do not for real trading.
//
// WARNING:
// - For purpose educate only
// - This script to change bars colors.
////////////////////////////////////////////////////////////
Reversal123(Length, KSmoothing, DLength, Level) =>
vFast = sma(stoch(close, high, low, Length), KSmoothing)
vSlow = sma(vFast, DLength)
pos = 0.0
pos := iff(close[2] < close[1] and close > close[1] and vFast < vSlow and vFast > Level, 1,
iff(close[2] > close[1] and close < close[1] and vFast > vSlow and vFast < Level, -1, nz(pos[1], 0)))
pos
EMA2_20(MA_Length, MA_xPrice) =>
xXA = ema(MA_xPrice, MA_Length)
nHH = max(high, high[1])
nLL = min(low, low[1])
nXS = iff((nLL > xXA)or(nHH < xXA), nLL, nHH)
pos = 0.0
pos := iff(nXS > close[1] , -1, iff(nXS < close[1] , 1, nz(pos[1], 0)))
pos
strategy(title="Combo Backtest 123 Reversal and 2/20 EMA", shorttitle="Combo Backtest", overlay = true)
Length = input(14, minval=1)
KSmoothing = input(1, minval=1)
DLength = input(3, minval=1)
Level = input(50, minval=1)
MA_Length = input(20, minval=1)
reverse = input(false, title="Trade reverse")
MA_xPrice = close
posReversal123 = Reversal123(Length, KSmoothing, DLength, Level)
posEMA2_20 = EMA2_20(MA_Length, MA_xPrice)
pos = iff(posReversal123 == 1 and posEMA2_20 == 1 , 1,
iff(posReversal123 == -1 and posEMA2_20 == -1, -1, 0))
possig = iff(reverse and pos == 1, -1,
iff(reverse and pos == -1, 1, pos))
if (possig == 1)
strategy.entry("Long", strategy.long)
if (possig == -1)
strategy.entry("Short", strategy.short)
if (possig == 0)
strategy.close_all()
barcolor(possig == -1 ? red: possig == 1 ? green : blue )