
概述
极化分形效率(Polarized Fractal Efficiency,PFE)交易策略通过应用分形几何和混沌理论的概念,测量价格运动的效率。价格运动越线性和高效,两个点之间的距离就越短,价格运动的效率也就越高。
策略原理
PFE交易策略的核心指标是极化分形效率(PFE)。该指标基于下述公式计算:
PFE = sqrt(pow(close - close[Length], 2) + 100)
其中,Length为回看窗口期,该参数通过输入设置。PFE实际上是衡量价格在Length期间内运动的“长度”,它使用欧几里得距离(直线距离)来近似衡量。
为了评估价格运动的效率,我们需要一个用于对比的基准。这个基准是价格在Length期间内按照实际顺序连接而成路径的长度,称为C2C(Close to Close),计算公式如下:
C2C = sum(sqrt(pow((close - close[1]), 2) + 1), Length)
这样,我们就可以计算出价格运动的分形效率xFracEff:
xFracEff = iff(close - close[Length] > 0, round((PFE / C2C) * 100) , round(-(PFE / C2C) * 100))
如果价格上涨,分数为正值,如果下跌,则为负值。绝对值越大,表示运动越不效率。
为了产生交易信号,我们计算xEMA,即xFracEff的指数移动平均。并设定买入和卖出通道:
            xEMA = ema(xFracEff, LengthEMA)

BuyBand = input(50)
SellBand = input(-50)
当xEMA上穿BuyBand generate买入信号;当xEMA下穿SellBand generate卖出信号。
优势分析
PFE交易策略具有以下优势:
- 应用独特的分形几何和混沌理论方法,从另一个角度衡量价格运动效率
- 回避常规技术指标的一些问题,如曲线拟合
- 可以通过调整参数找到适合不同市场环境的设置
- 交易规则简单清晰,容易实施
风险分析
PFE交易策略也存在以下风险:
- 和所有指标策略一样,参数优化困难,容易过度优化
- 在市场剧烈波动时,买卖信号可能不可靠
- 需谨慎处理极值,如价格突然出现间隙
- 需承受一定的时间滞后,产生信号时可能已经错过最佳入场点
优化方向
PFE交易策略可以从以下几个方面进行优化:
- 尝试不同的Length参数组合,找到最佳平衡点
- 优化买卖通道参数,降低错误交易概率
- 加入止损机制,控制单笔损失
- 结合其它指标,提高信号质量
- 动态调整参数,适应市场环境变化
总结
PFE交易策略立足于分形几何和混沌理论的角度,提出了一个新颖的方法来衡量价格运动的效率。相比常规技术指标,这种方法有其独特优势,但也面临一定程度的时间滞后,参数优化,信号质量方面的问题。通过不断测试与优化,PFE策略有望成为一个可靠的量化交易策略选择。
策略源码
Pine
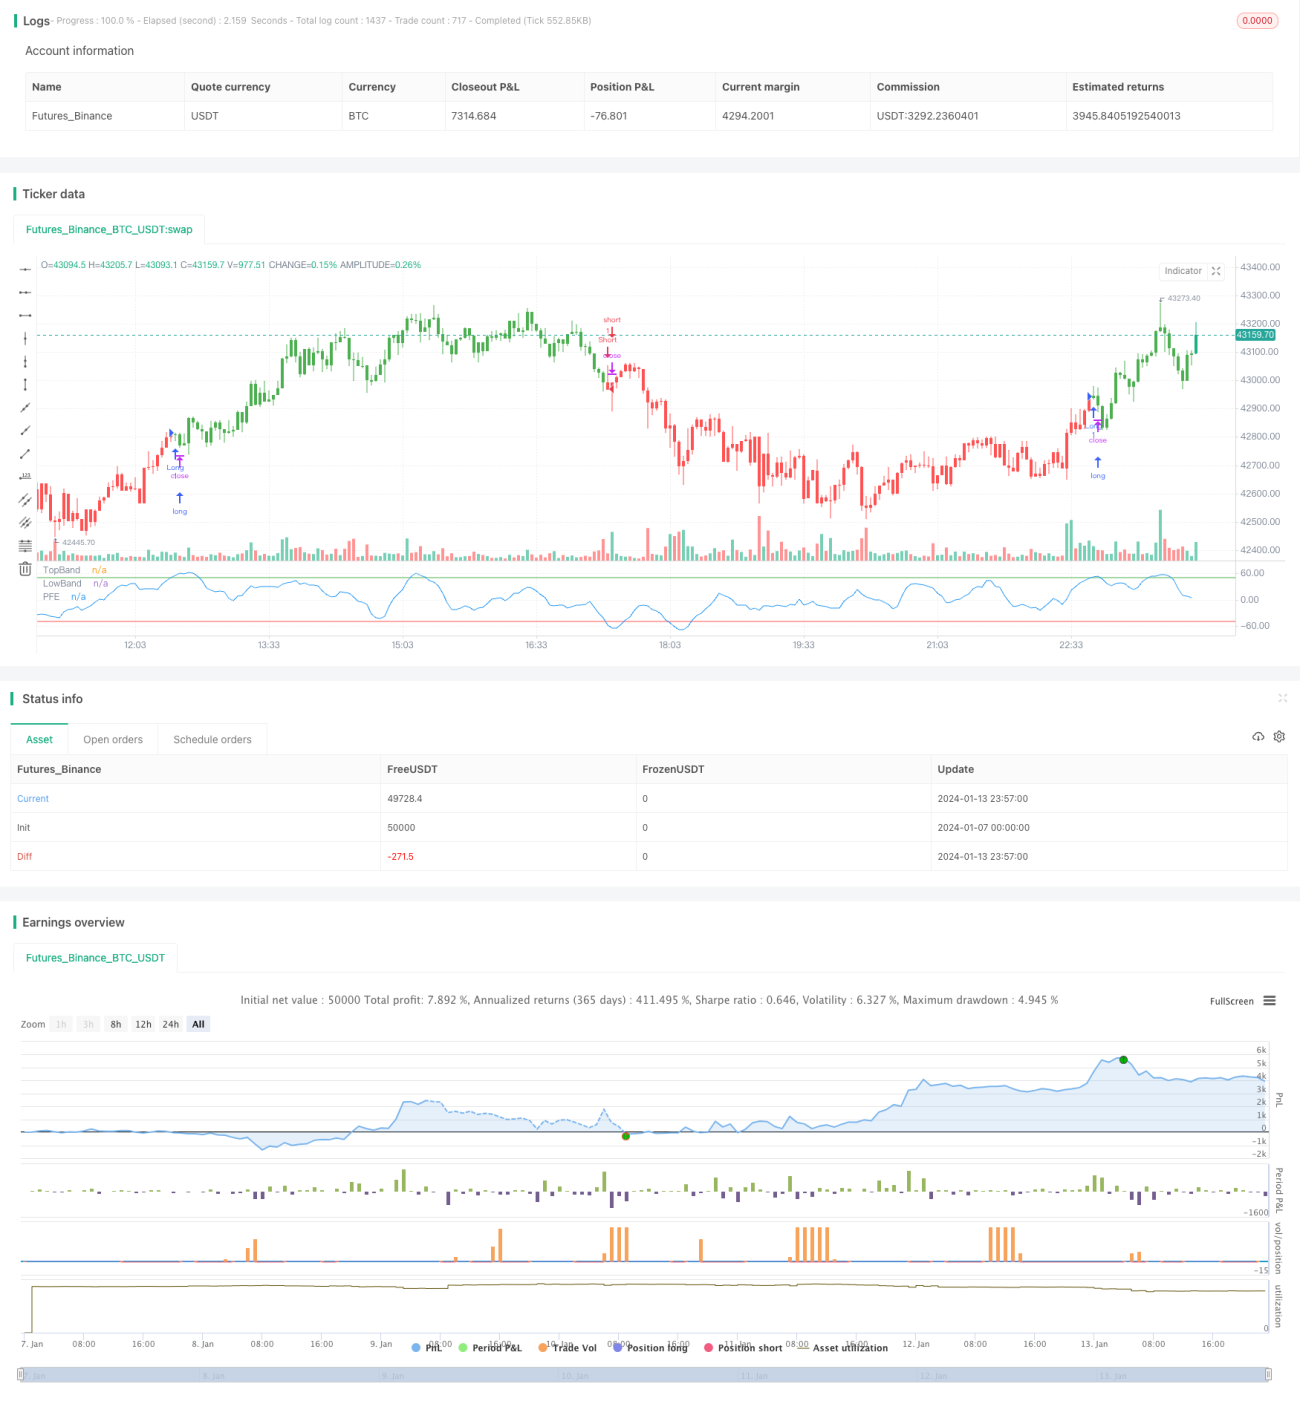
/*backtest
start: 2024-01-07 00:00:00
end: 2024-01-14 00:00:00
period: 3m
basePeriod: 1m
exchanges: [{"eid":"Futures_Binance","currency":"BTC_USDT"}]
*/

//@version=2
////////////////////////////////////////////////////////////
//  Copyright by HPotter v1.0 29/09/2017
// The Polarized Fractal Efficiency (PFE) indicator measures the efficiency 策略参数
相关策略
评论
全部评论 (0)
暂无数据
- 1