概述
动量趋势跟踪交易策略是一种结合趋势跟踪和超买超卖指标的量化交易策略。该策略利用EMA均线判断价格趋势方向,并结合RSI指标判断是否超买超卖,在趋势方向确定的前提下进行入场。同时,该策略还利用需求区和供给区判断更精确的入场点位。
策略原理
该策略主要基于EMA均线和RSI指标判断价格趋势和超买超卖情况。具体来说,策略通过快线EMA50天和慢线EMA200天的金叉死叉来判断价格趋势,当快线上穿慢线时为看涨信号,待价格突破快线时买入;当快线下穿慢线时为看跌信号,待价格跌破慢线时卖出。同时,策略还结合RSI指标来过滤假突破,RSI高于55为超买区,低于45为超卖区,只有在非超买超卖情况下的趋势信号才会出发入场。最后,策略利用需求区和供给区进一步筛选入场时机,只在需求区买入和供给区卖出,从而确保更好的入场点位。
优势分析
该策略结合趋势跟踪和超买超卖指标,能有效过滤假突破带来的噪音,确保交易信号的质量。此外,利用需求区和供给区判断入场时机,也使得入场点位更加精准。总的来说,该策略具有以下优势:
利用EMA均线判断主要趋势方向,避免在震荡行情中被套。
RSI指标有效过滤超买超卖情况下的假突破。
需求区和供给区使入场时机更加精准。
结合多种指标,使策略更加稳健。
风险分析
尽管该策略有其优势,但也存在一定的风险需要注意。主要的风险包括:
强势行情中存在被套利空间。当行情出现强势突破时,EMA均线和RSI都可能出现滞后,导致错过首次入场机会。可以通过适当缩短参数周期来优化。
震荡行情中可能出现 whipsaw。当价格在均线附近震荡时,容易触发止损。可以适当放宽止损线距离来优化。
需求区和供给区存在一定主观性。这些区域的判断需要结合更多因素,如交易量变化等。
优化方向
该策略主要可以从以下几个方向进行优化:
动态调整EMA参数,在不同市况下快速响应价格变化。
优化RSI参数,使其更好地表征超买超卖现象。
利用更多指标判断需求区和供给区,减少主观性。
添加止损止盈策略,控制单笔损益。
测试不同品种的参数健壮性,评估策略适应性。
总结
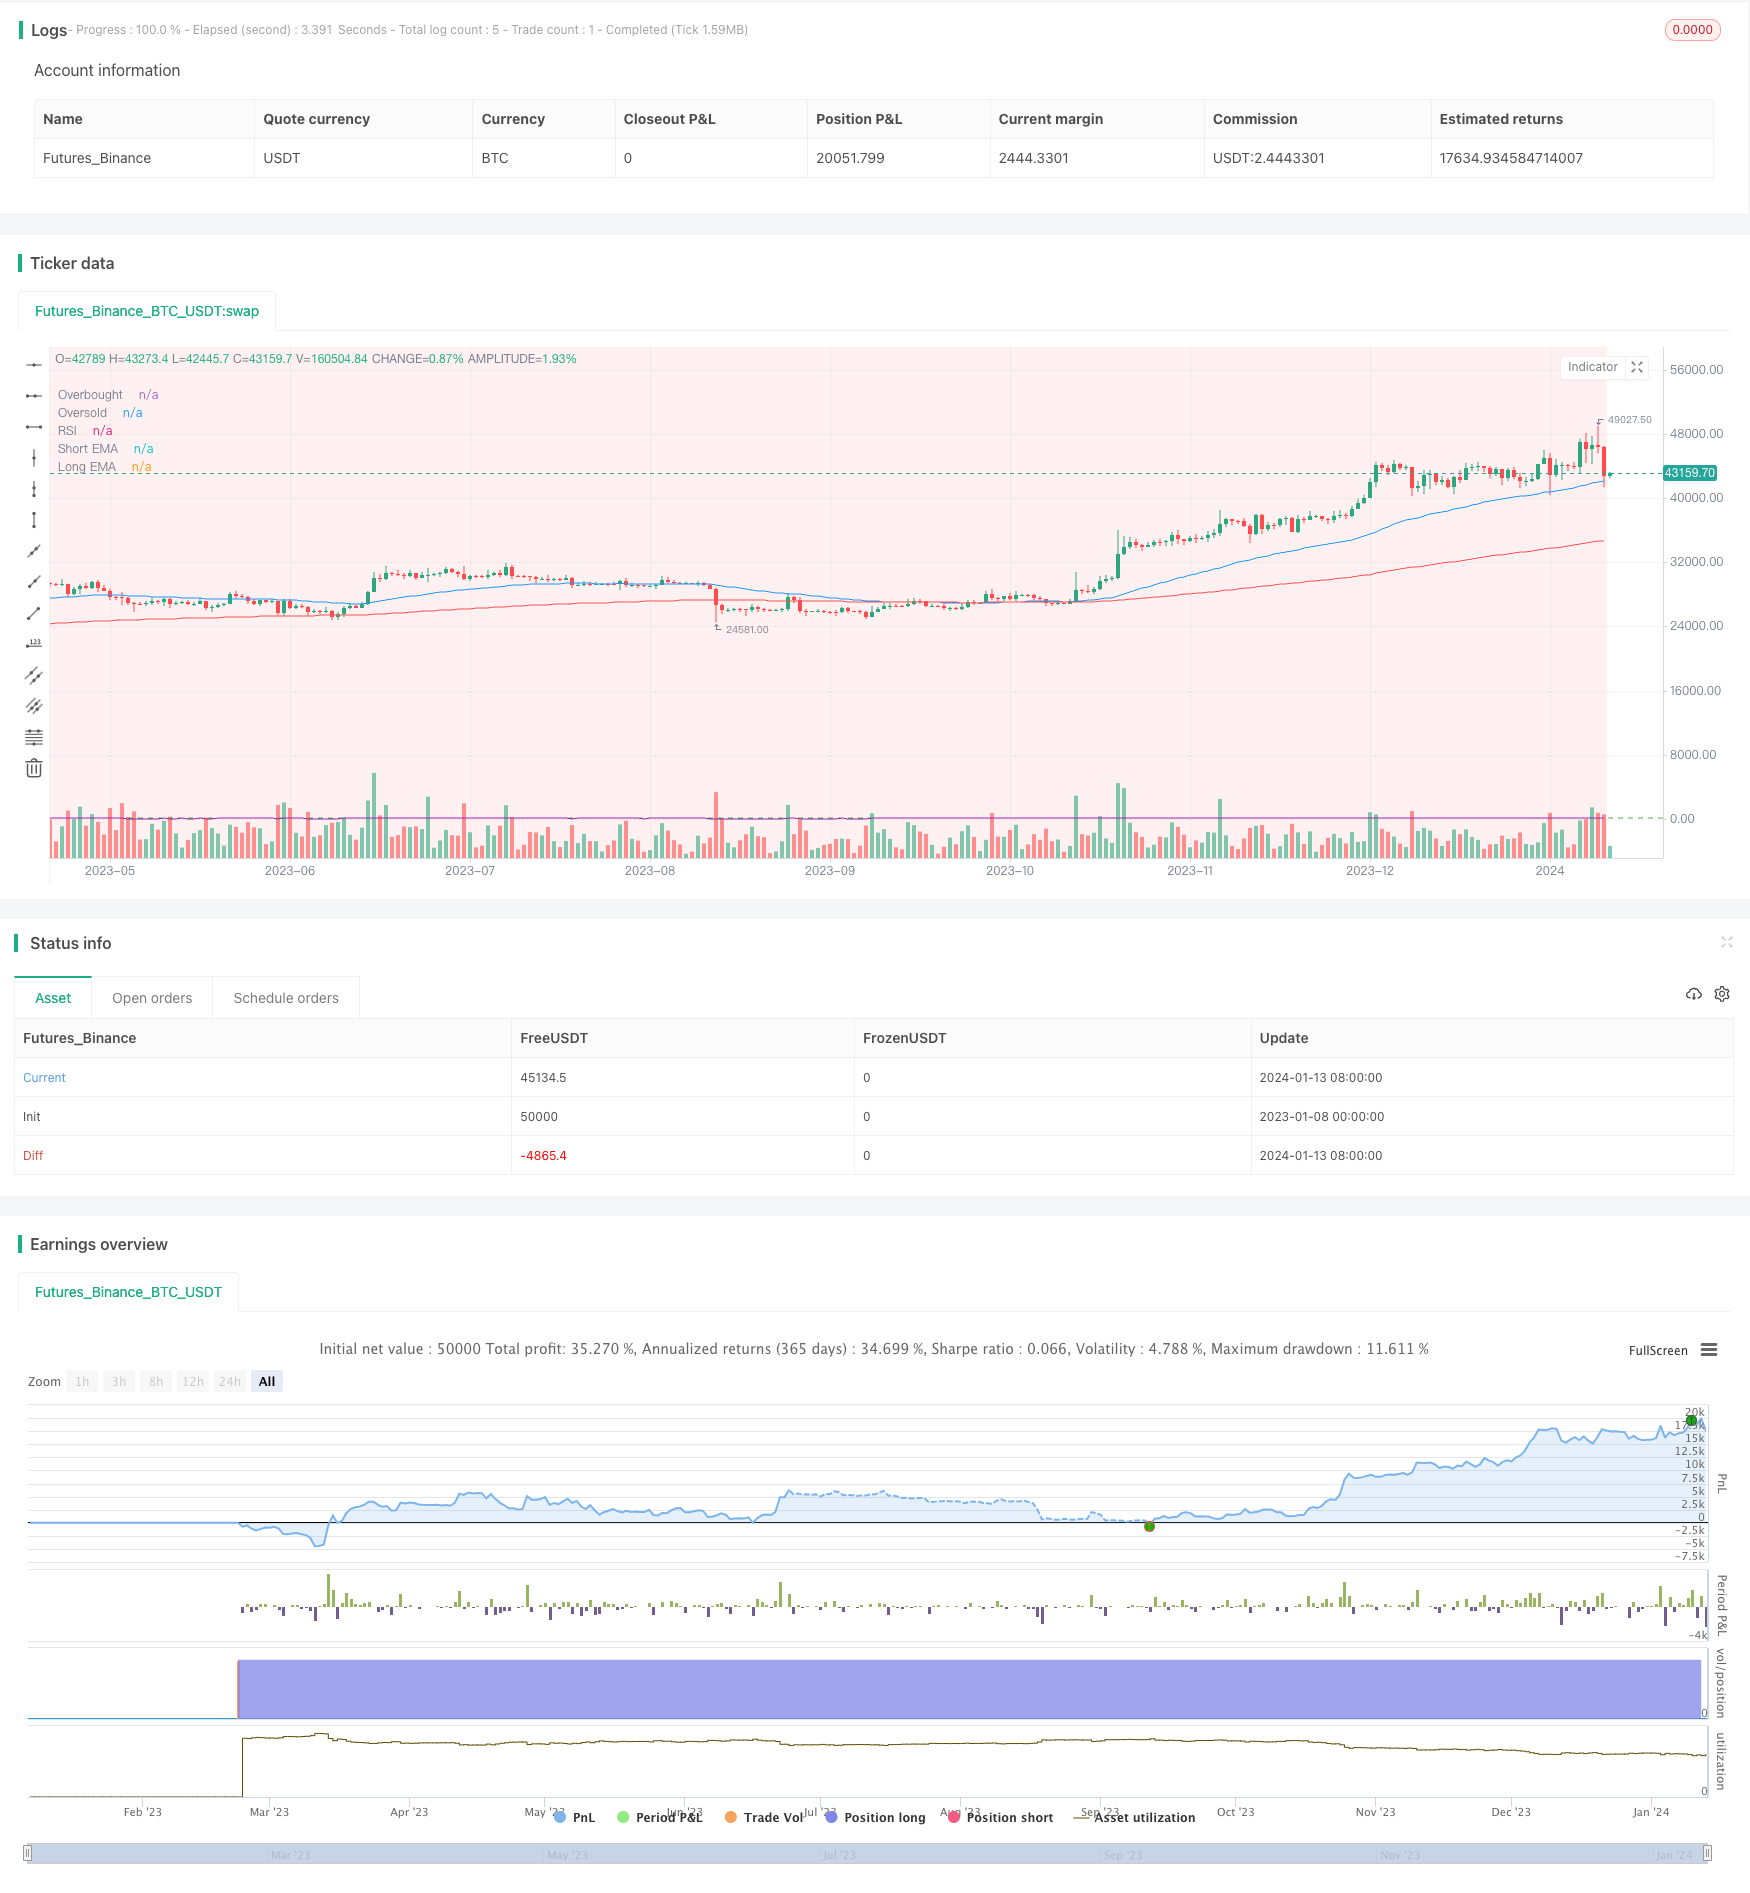
动量趋势跟踪交易策略综合考虑了趋势、超买超卖状态和需求供给情况,在稳定筛选信号的基础上确保高质量入场。该策略有效控制了趋势交易中的重要风险,展示了多种技术指标和概念的有机结合。未来可从参数优化、止损机制、品种适应性等方面进行改进,使策略效果更加突出。
/*backtest
start: 2023-01-08 00:00:00
end: 2024-01-14 00:00:00
period: 1d
basePeriod: 1h
exchanges: [{"eid":"Futures_Binance","currency":"BTC_USDT"}]
*/

//@version=4
strategy("Trading Trend Following", overlay=true)

// Define EMA parameters
emaLengthShort = input(50, title="Short EaMA Length")
emaLengthLong = input(200, title="Long EMA Length")
ema50 = ema(close, emaLengthShort)
ema200 = ema(close, emaLengthLong)

// Calculate RSI
rsiLength = input(14, title="RSI Length")
rsiValue = rsi(close, rsiLength)

// Define Demand and Supply zones
demandZone = input(true, title="Demand Zone")
supplyZone = input(true, title="Supply Zone")

// Define Buy and Sell conditions
buyCondition = crossover(ema50, ema200) and close > ema50 and rsiValue > 55
sellCondition = crossunder(ema50, ema200) and close < ema50 and rsiValue < 45

// Entry point buy when the price is closed above Demand and EMA gives a buy signal
buyEntryCondition = close > ema50 and demandZone
strategy.entry("Buy", strategy.long, when=buyCondition and buyEntryCondition)

// Entry point sell when the price is closed below Supply and EMA gives a sell signal
sellEntryCondition = close < ema50 and supplyZone
strategy.entry("Sell", strategy.short, when=sellCondition and sellEntryCondition)

// Plot EMAs for visualization
plot(ema50, color=color.blue, title="Short EMA")
plot(ema200, color=color.red, title="Long EMA")

// Plot RSI for visualization
hline(55, "Overbought", color=color.red)
hline(45, "Oversold", color=color.green)
plot(rsiValue, color=color.purple, title="RSI")

// Plot Demand and Supply zones
bgcolor(demandZone ? color.new(color.green, 90) : na)
bgcolor(supplyZone ? color.new(color.red, 90) : na)