概述
该策略通过计算乘法移动平均线,结合价格和PMax指标的交叉来判断趋势方向,采用长空双向交易方式,在趋势向上时做多,趋势向下时做空,实时评估持仓风险,以获利退出。
策略原理
该策略的核心指标是乘法移动平均线。指标参数包括:ATR周期长度、ATR倍数、移动平均线类型和长度。ATR值代表期间波动幅度。乘法移动平均线等于期间价格平均值加/减ATR倍数与ATR的乘积。当价格高于乘法移动平均线时为看涨信号;当价格低于乘法移动平均线时为看跌信号。
PMax指标代表止损或止盈价格。指标结合ATR值和趋势方向计算得到。在看涨市场中,PMax等于乘法移动平均线减去ATR值与倍数的乘积,作为止损线。在看跌市场中,PMax等于乘法移动平均线加上ATR值与倍数的乘积,作为止盈线。
当价格与PMax指标发生向上交叉时为做多信号;当价格与PMax指标发生向下交叉时为做空信号。策略以此进出场,在趋势向上做多,在趋势向下做空,动态跟踪止损止盈。
优势分析
该策略具有以下优势:
采用长空双向交易方式,能够全市场交易,包容性强。
应用乘法移动平均线指标,交易信号稳定可靠。
结合PMax指标进行止盈止损,有效控制风险。
计算周期和倍数参数可调,适应性广。
风险分析
该策略也存在一定的风险:
参数设置不当可能导致 whipsaw 交易亏损。
空头交易需要注意杠杆限制的风险。
突发事件造成市场剧烈波动的风险难以规避。
对应解决方法: 1. 优化参数,降低 whipsaw 出现概率。
适当控制杠杆限额,分散头寸风险。
增大ATR倍数,扩大止损范围。
优化方向
该策略可从以下方面进行优化:
测试不同市场及周期参数的稳定性。
应用机器学习算法自动优化参数。
结合深度学习等技术判断市场结构。
整合更多数据源提高决策效果。
总结
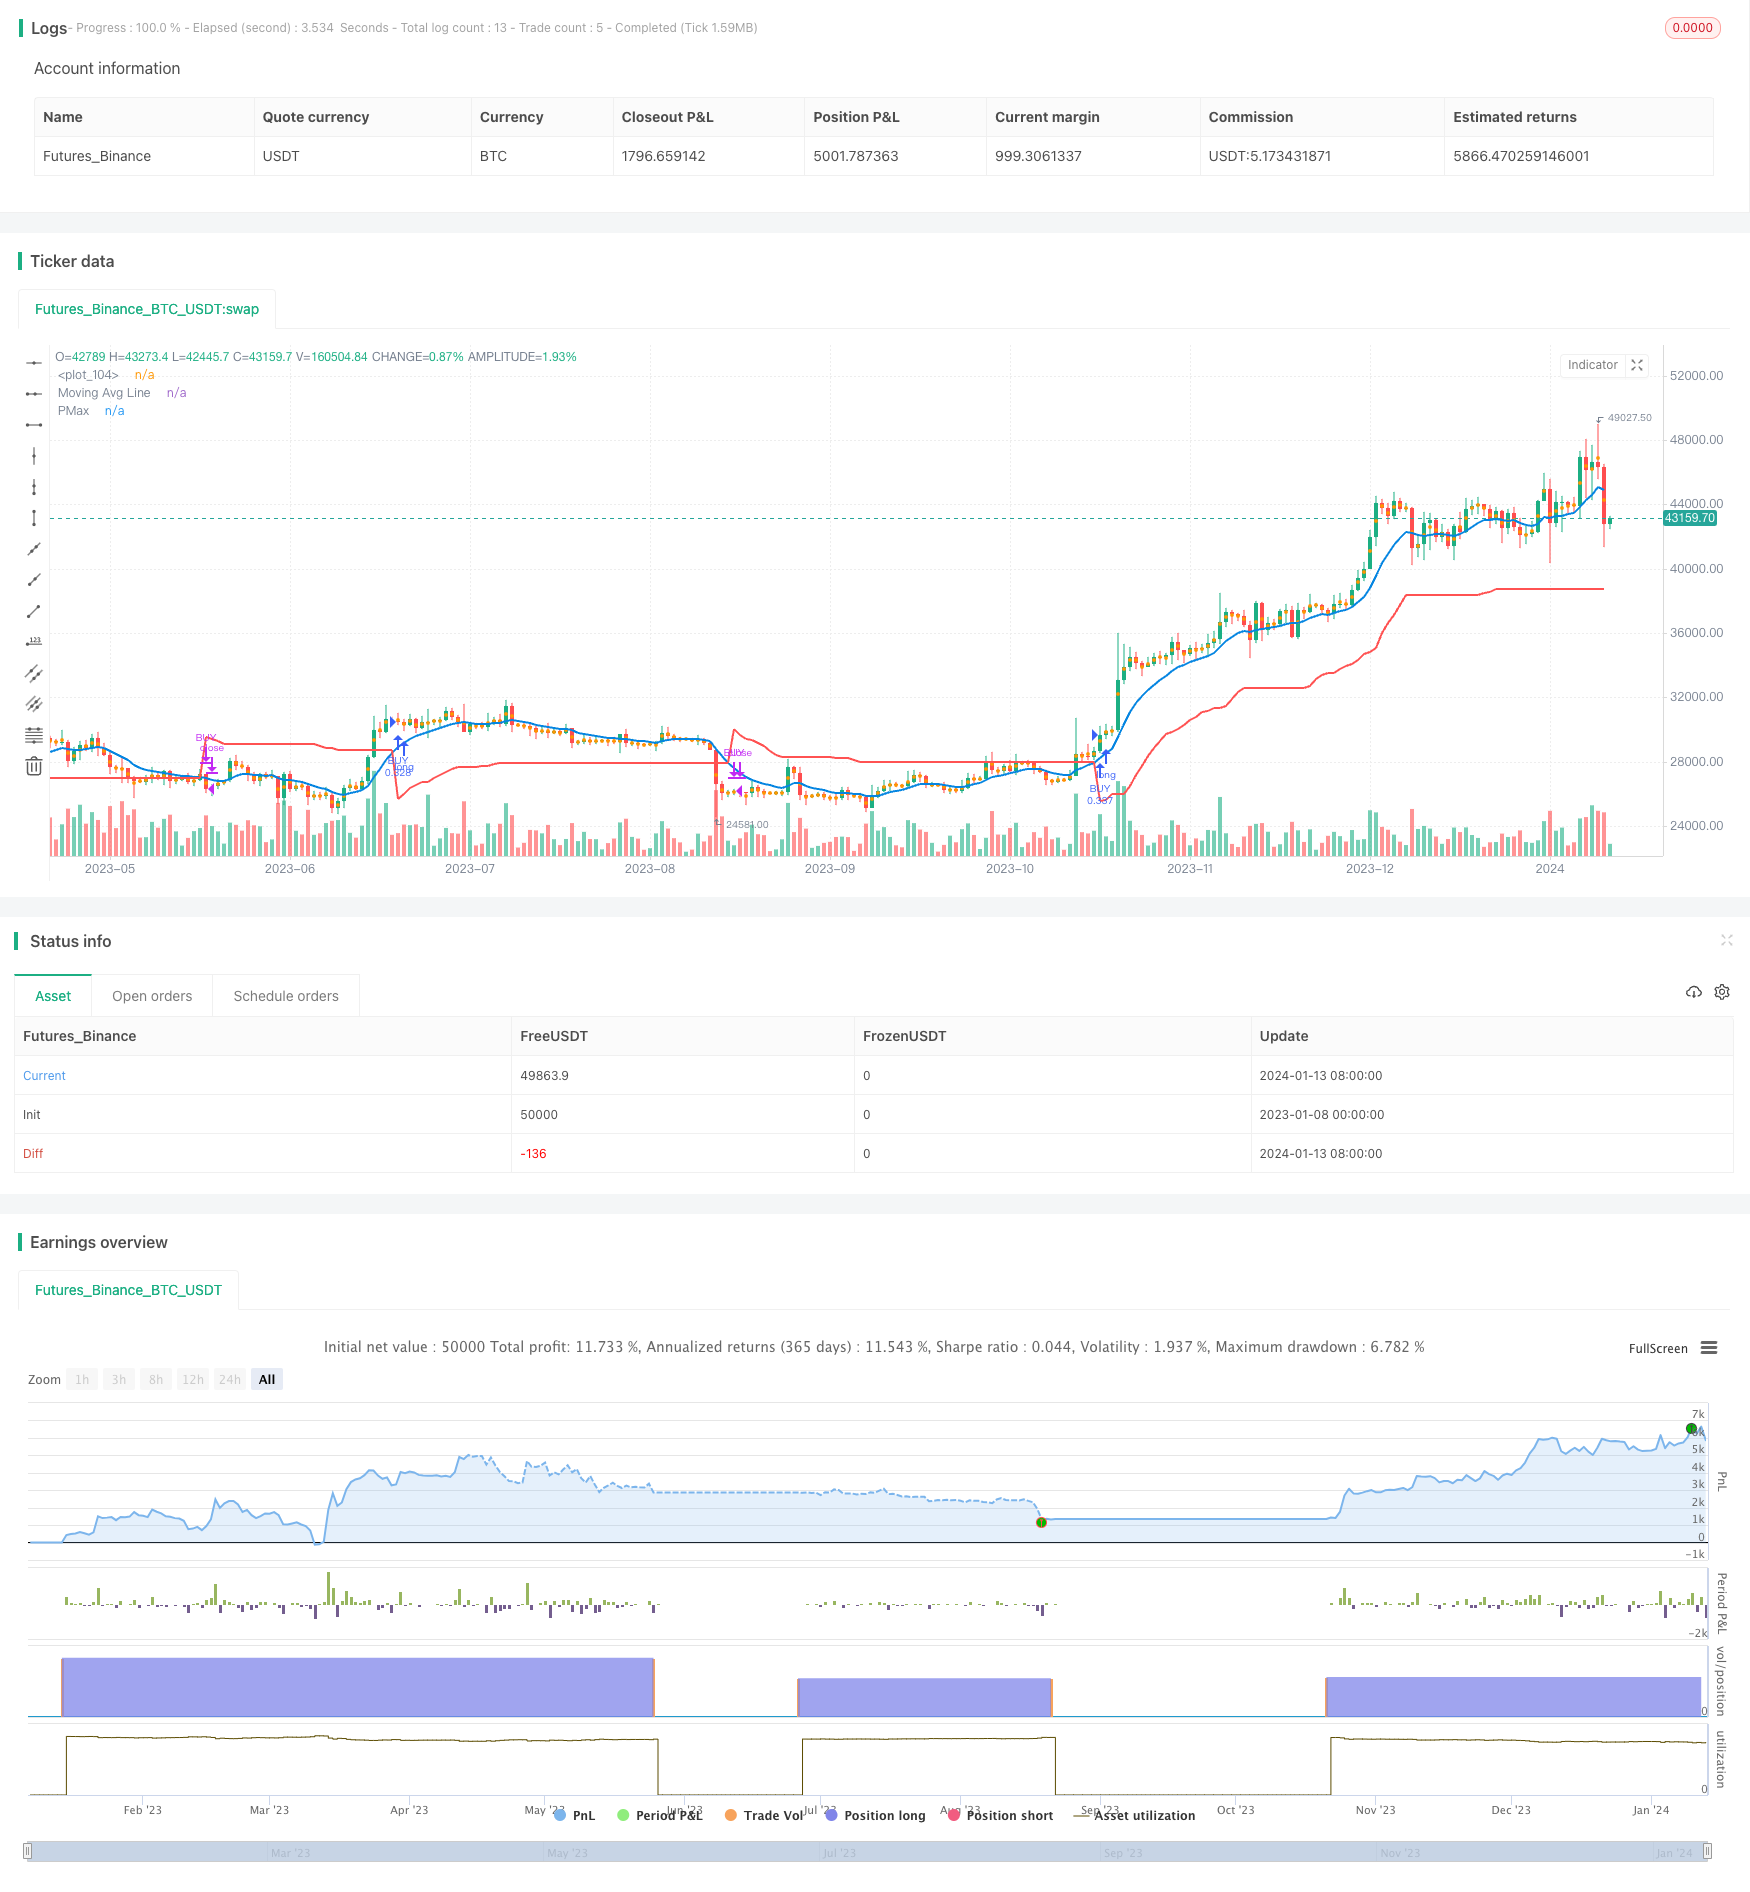
本策略整体运行稳健,具有较强的包容性。采用长空双向交易和动态止损止盈方式,能够有效控制风险。通过参数优化和模型迭代,可望获得更好的拟合性和交易效果。总体来说,该策略值得长期关注与应用。
/*backtest
start: 2023-01-08 00:00:00
end: 2024-01-14 00:00:00
period: 1d
basePeriod: 1h
exchanges: [{"eid":"Futures_Binance","currency":"BTC_USDT"}]
*/

// This source code is subject to the terms of the Mozilla Public License 2.0 at https://mozilla.org/MPL/2.0/
// © melihtuna
//developer: @KivancOzbilgic
//author: @KivancOzbilgic
//stretegy converter: @crypto_melih
//@version=4

strategy("Profit Maximizer Strategy Long-Short", shorttitle="PMax-Strategy", overlay=true, default_qty_type=strategy.cash, default_qty_value=10000, initial_capital=10000, currency=currency.USD, commission_value=0, commission_type=strategy.commission.percent)

src = input(hl2, title="Source")
Periods = input(title="ATR Length", type=input.integer, defval=10)
Multiplier = input(title="ATR Multiplier", type=input.float, step=0.1, defval=3.0)
mav = input(title="Moving Average Type", defval="EMA", options=["SMA", "EMA", "WMA", "TMA", "VAR", "WWMA", "ZLEMA", "TSF"])
length =input(10, "Moving Average Length", minval=1)
condition = input(title="Signal Type", defval="Only Crossing Signals", options=["Only Crossing Signals", "Only Price/Pmax Crossing Signals"])
changeATR= input(title="Change ATR Calculation Method ?", type=input.bool, defval=true)
showsupport = input(title="Show Moving Average?", type=input.bool, defval=true)
//showsignalsk = input(title="Show Crossing Signals?", type=input.bool, defval=true)
//showsignalsc = input(title="Show Price/Pmax Crossing Signals?", type=input.bool, defval=false)
highlighting = input(title="Highlighter On/Off ?", type=input.bool, defval=true)
long_short = input(defval = false, title = "Long-Short", type=input.bool)
atr2 = sma(tr, Periods)
atr= changeATR ? atr(Periods) : atr2
valpha=2/(length+1)
vud1=src>src[1] ? src-src[1] : 0
vdd1=src<src[1] ? src[1]-src : 0
vUD=sum(vud1,9)
vDD=sum(vdd1,9)
vCMO=nz((vUD-vDD)/(vUD+vDD))
VAR=0.0
VAR:=nz(valpha*abs(vCMO)*src)+(1-valpha*abs(vCMO))*nz(VAR[1])
wwalpha = 1/ length
WWMA = 0.0
WWMA := wwalpha*src + (1-wwalpha)*nz(WWMA[1])
zxLag = length/2==round(length/2) ? length/2 : (length - 1) / 2
zxEMAData = (src + (src - src[zxLag]))
ZLEMA = ema(zxEMAData, length)
lrc = linreg(src, length, 0)
lrc1 = linreg(src,length,1)
lrs = (lrc-lrc1)
TSF = linreg(src, length, 0)+lrs
getMA(src, length) =>
    ma = 0.0
    if mav == "SMA"
        ma := sma(src, length)
        ma

    if mav == "EMA"
        ma := ema(src, length)
        ma

    if mav == "WMA"
        ma := wma(src, length)
        ma

    if mav == "TMA"
        ma := sma(sma(src, ceil(length / 2)), floor(length / 2) + 1)
        ma

    if mav == "VAR"
        ma := VAR
        ma

    if mav == "WWMA"
        ma := WWMA
        ma

    if mav == "ZLEMA"
        ma := ZLEMA
        ma

    if mav == "TSF"
        ma := TSF
        ma
    ma

MAvg=getMA(src, length)
longStop = MAvg - Multiplier*atr
longStopPrev = nz(longStop[1], longStop)
longStop := MAvg > longStopPrev ? max(longStop, longStopPrev) : longStop
shortStop = MAvg + Multiplier*atr
shortStopPrev = nz(shortStop[1], shortStop)
shortStop := MAvg < shortStopPrev ? min(shortStop, shortStopPrev) : shortStop
dir = 1
dir := nz(dir[1], dir)
dir := dir == -1 and MAvg > shortStopPrev ? 1 : dir == 1 and MAvg < longStopPrev ? -1 : dir
PMax = dir==1 ? longStop: shortStop
plot(showsupport ? MAvg : na, color=#0585E1, linewidth=2, title="Moving Avg Line")
pALL=plot(PMax, color=color.red, linewidth=2, title="PMax", transp=0)
alertcondition(cross(MAvg, PMax), title="Cross Alert", message="PMax - Moving Avg Crossing!")
alertcondition(crossover(MAvg, PMax), title="Crossover Alarm", message="Moving Avg BUY SIGNAL!")
alertcondition(crossunder(MAvg, PMax), title="Crossunder Alarm", message="Moving Avg SELL SIGNAL!")
alertcondition(cross(src, PMax), title="Price Cross Alert", message="PMax - Price Crossing!")
alertcondition(crossover(src, PMax), title="Price Crossover Alarm", message="PRICE OVER PMax - BUY SIGNAL!")
alertcondition(crossunder(src, PMax), title="Price Crossunder Alarm", message="PRICE UNDER PMax - SELL SIGNAL!")
buySignalk = crossover(MAvg, PMax)
//plotshape(buySignalk and showsignalsk ? PMax*0.995 : na, title="Buy", text="Buy", location=location.absolute, style=shape.labelup, size=size.tiny, color=color.green, textcolor=color.white, transp=0)
sellSignallk = crossunder(MAvg, PMax)
//plotshape(sellSignallk and showsignalsk ? PMax*1.005 : na, title="Sell", text="Sell", location=location.absolute, style=shape.labeldown, size=size.tiny, color=color.red, textcolor=color.white, transp=0)
buySignalc = crossover(src, PMax)
//plotshape(buySignalc and showsignalsc ? PMax*0.995 : na, title="Buy", text="Buy", location=location.absolute, style=shape.labelup, size=size.tiny, color=#0F18BF, textcolor=color.white, transp=0)
sellSignallc = crossunder(src, PMax)
//plotshape(sellSignallc and showsignalsc ? PMax*1.005 : na, title="Sell", text="Sell", location=location.absolute, style=shape.labeldown, size=size.tiny, color=#0F18BF, textcolor=color.white, transp=0)
mPlot = plot(ohlc4, title="", style=plot.style_circles, linewidth=0,display=display.none)
longFillColor = highlighting ? (MAvg>PMax ? color.green : na) : na
shortFillColor = highlighting ? (MAvg<PMax ? color.red : na) : na
fill(mPlot, pALL, title="UpTrend Highligter", color=longFillColor)
fill(mPlot, pALL, title="DownTrend Highligter", color=shortFillColor)

if(condition=="Only Crossing Signals")
    strategy.entry("BUY", strategy.long, when = buySignalk)
else
    strategy.entry("BUY", strategy.long, when = buySignalc)

if(long_short)
    if(condition=="Only Crossing Signals")
        strategy.entry("SELL", strategy.short, when = sellSignallk)
    else
        strategy.entry("SELL", strategy.short, when = sellSignallc)
else
    if(condition=="Only Crossing Signals")
        strategy.close("BUY", when = sellSignallk)
    else
        strategy.close("BUY", when = sellSignallc)