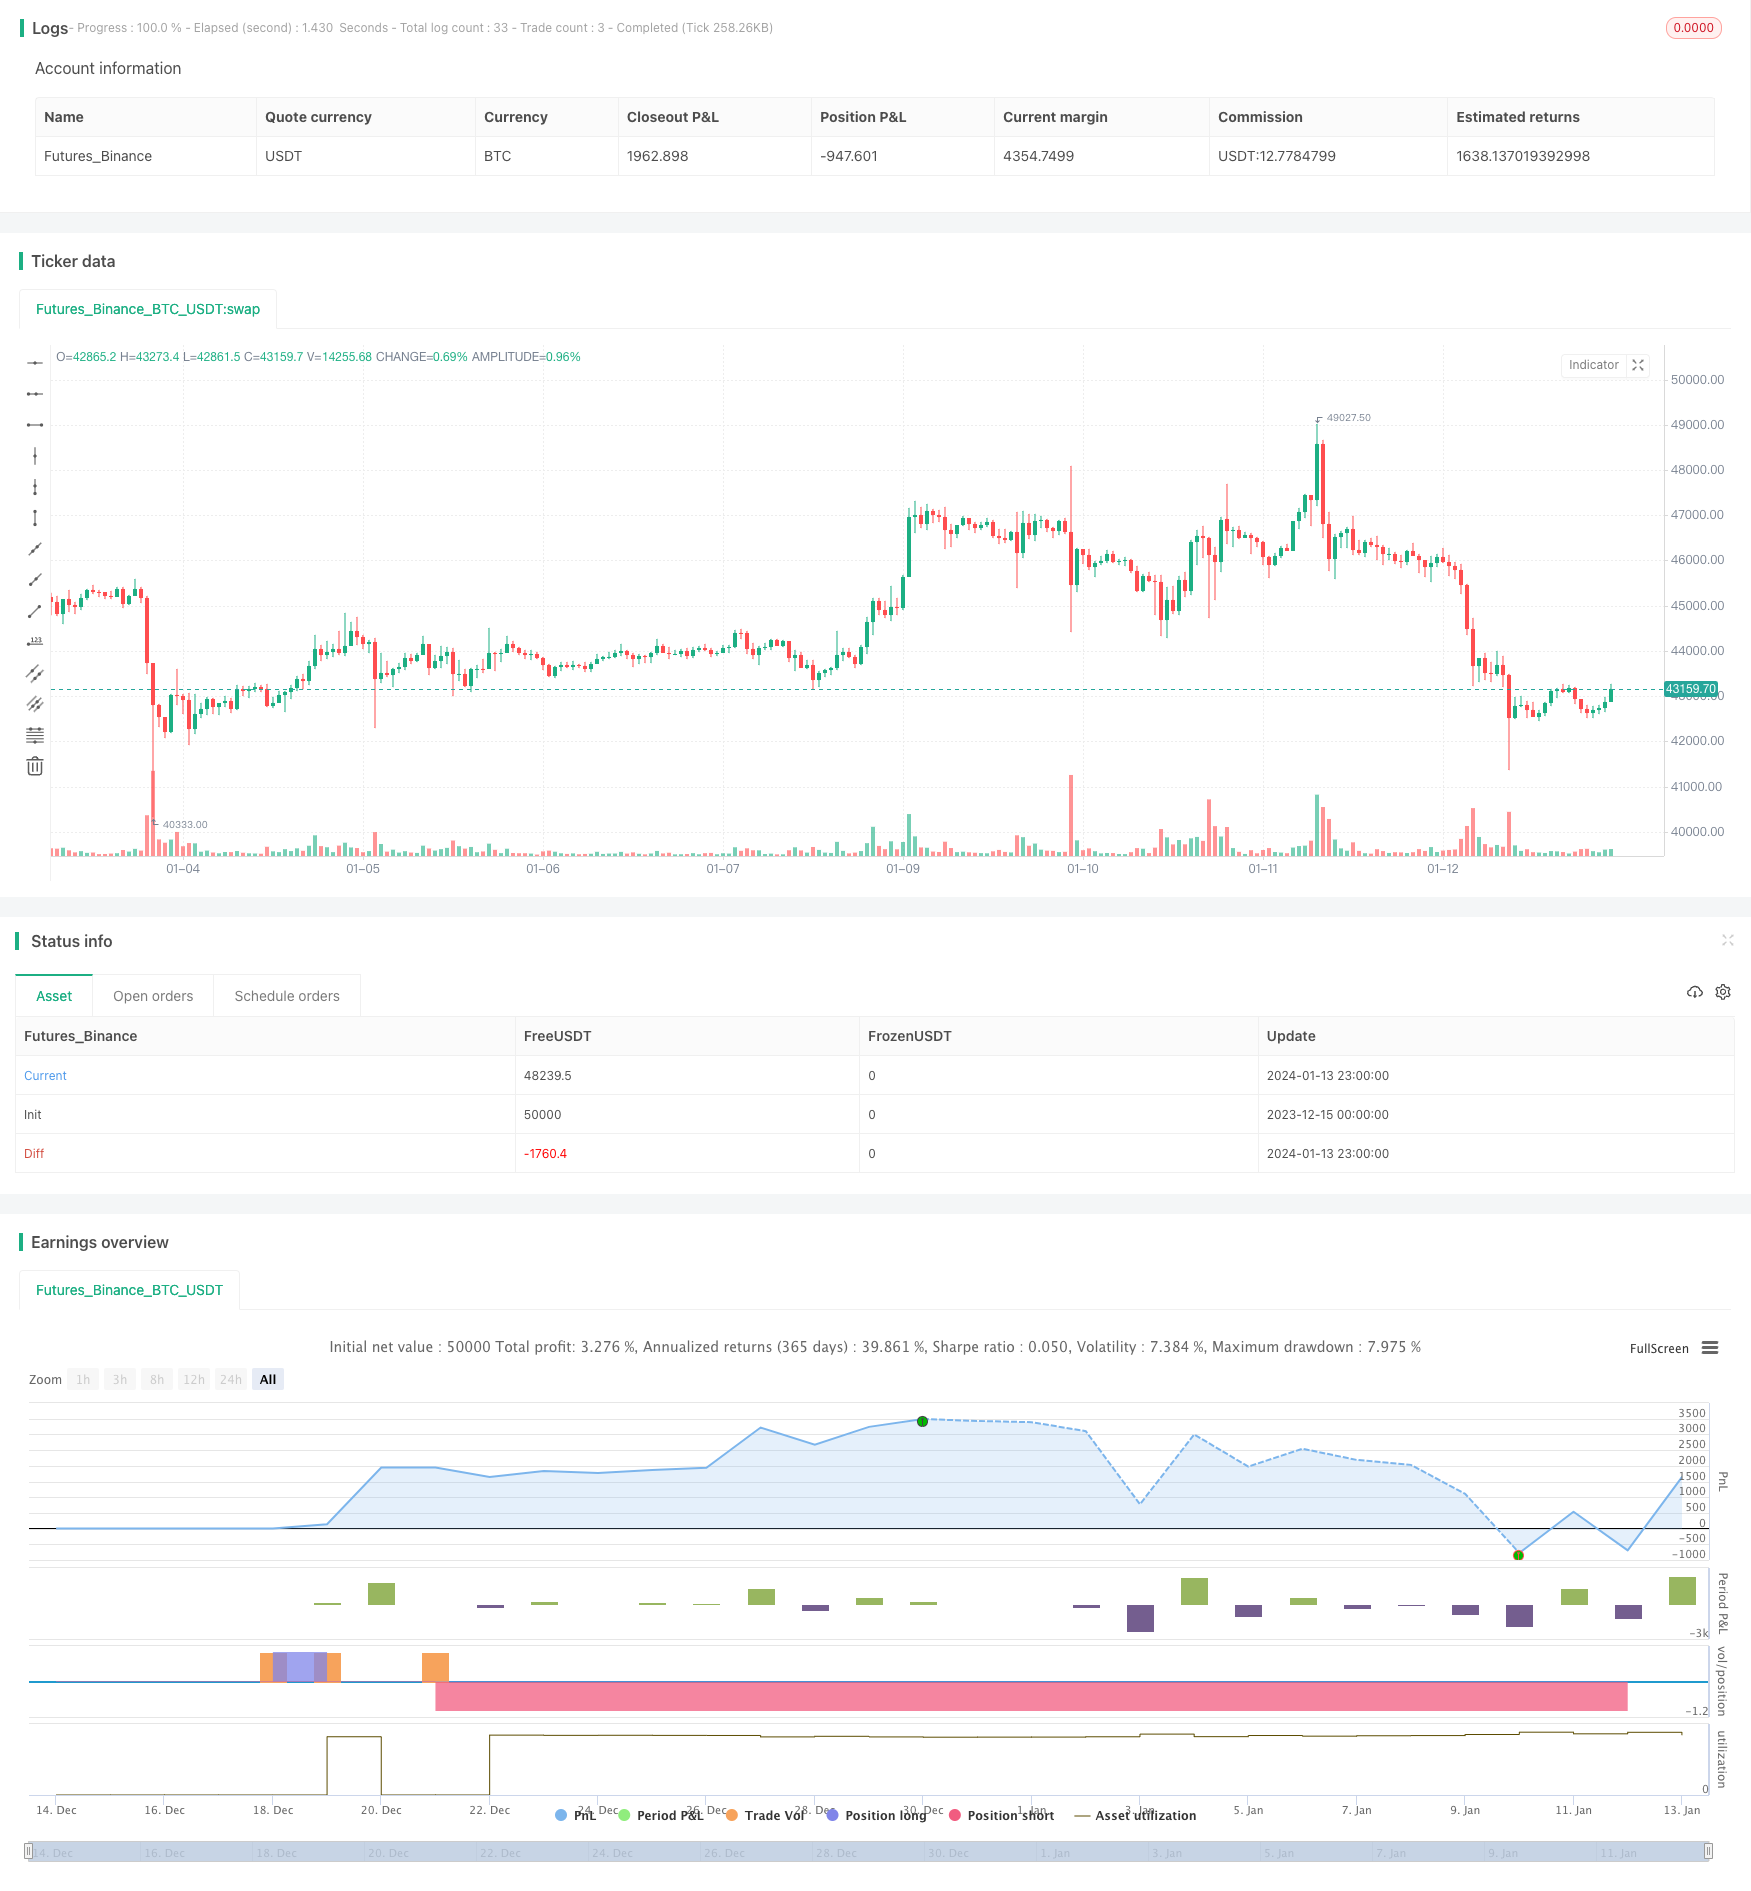
概述
确认发散策略利用RSI指标和Awesome Oscillator指标的双重发散信号来确定更可靠的入市时机。当价格形成新高或新低,而RSI和AO指标形成反向的高点或低点时,就是发散信号。此策略要求两种指标同时发散,从而过滤掉部分假信号,提高入市效果。
策略原理
该策略基于价格涨跌幅度与RSI和AO指标值之间的发散来判断买卖点。具体判断方法如下:
多头发散:价格形成较近期新的低点,而RSI和AO形成较近期新的高点,即价格下跌而RSI和AO上涨,构成多头发散信号。
空头发散:价格形成较近期新的高点,而RSI和AO形成较近期新的低点,即价格上涨而RSI和AO下跌,构成空头发散信号。
策略要求两种指标同时满足发散条件,从而避免单一指标的假发散带来的错误信号。当发散信号成立时,在布林带下轨或上轨附近设置止损单,具体止损点为下轨上方或上轨下方。
优势分析
该策略具有以下优势:
双重指标过滤增加信号的可靠性,避免单一指标的假发散信号。
利用指标的发散特性判断买卖点,回撤可能性较小。
发散信号具有较好的持续性,获利空间大。
在关键支撑或阻力附近设置止损,减小个别巨亏的可能性。
风险分析
该策略也存在一些风险:
双重过滤条件同时成立的时间较少,可能错过部分交易机会。
发散并不是百分之百可靠的信号,个别情况下可能出现亏损。
布林带的参数设置不当可能导致止损过于宽松或过于窄隘。
优化方向
该策略可以从以下几个方面进行优化:
调整发散判断的周期参数,优化发散信号的参数。
测试不同的止损方式,如trailing stop或动态止损。
增加其他指标过滤,如交易量等,进一步提高信号的可靠性。
综合考虑趋势、支持阻力等因素,识别发散信号的质量。
总结
确认发散策略通过RSI和AO的双重发散信号判断入市时机,双重过滤机制有效减少假信号,提高获利概率。策略还在关键位设置止损以控制风险,具有较好的风险收益特征。通过参数优化、增加信号过滤等手段,可以进一步提升策略稳定性和交易效果。
/*backtest
start: 2023-12-15 00:00:00
end: 2024-01-14 00:00:00
period: 1h
basePeriod: 15m
exchanges: [{"eid":"Futures_Binance","currency":"BTC_USDT"}]
*/

//@version=3
strategy("Confirmed Divergence Strategy", overlay=true)
source = close
length = input(30, minval=1)
mult = input(2.0, minval=0.001, maxval=50)
// SETTING UP VARIABLES //

src = close

// RSI //
rsiprd = input(title="RSI period",defval=14)
rv = rsi(src,rsiprd)
ob = input(title="Overbought Level",  defval=70)
os = input(title="Oversold Level",  defval=30)
lengthAO1=input(title="Awesome Short MA", defval=5, minval=1) //5 periods
lengthAO2=input(title="Awesome Long MA", defval=34, minval=1) //34 periods


//Awesome//

AO = sma((high+low)/2, lengthAO1) - sma((high+low)/2, lengthAO2)

// look back periods //
x = input(title = "short lookback period",defval=5)
z = input(title = "long lookback period",defval=25)


// END SETUP //

////////////////////////
// BULLISH DIVERGENCE //
////////////////////////

// define lower low in price //

srcLL = src > lowest(src,x) and  lowest(src,x)<lowest(src,z)[x]

// define higher low in rsi //

rsiHL = rv>lowest(rv,x) and lowest(rv,x) > lowest(rv,z)[x] and lowest(rv,z)<os

// define higher low in AO //


aoHL = AO > lowest(AO,x) and lowest(AO,x) > lowest(AO,z)[x] and lowest(AO, x) < 0


BullishDiv = srcLL and rsiHL and aoHL


////////////////////////
// BEARISH DIVERGENCE //
////////////////////////

// define higher high in price //

srcHH = src < highest(src,x) and  highest(src,x)>highest(src,z)[x]

// define lower high in RSI //

rsiLH = rv<highest(rv,x) and highest(rv,x) < highest(rv,z)[x] and highest(rv,z)>ob

// define lower high in AO //
aoLH = AO<highest(AO,x) and highest(AO,x) < highest(AO,z)[x] and highest(AO, x) > 0

BearishDiv = srcHH and rsiLH and aoLH


basis = sma(source, length)
dev = mult * stdev(source, length)

upper = basis + dev
lower = basis - dev


if (BullishDiv)
    strategy.entry("DivLE", strategy.long, stop=lower, oca_name="BullishDiv",comment="DivLE")
else
    strategy.cancel(id="DivLE")

if (crossover(close, lower))
    strategy.close("DivSE")

if (crossunder(close, upper))
    strategy.close("DivLE")

if (BearishDiv)
    strategy.entry("DivSE", strategy.short, stop=upper, oca_name="BearishDiv",comment="DivSE")
else
    strategy.cancel(id="DivSE")

//plot(strategy.equity, title="equity", color=red, linewidth=2, style=areabr)