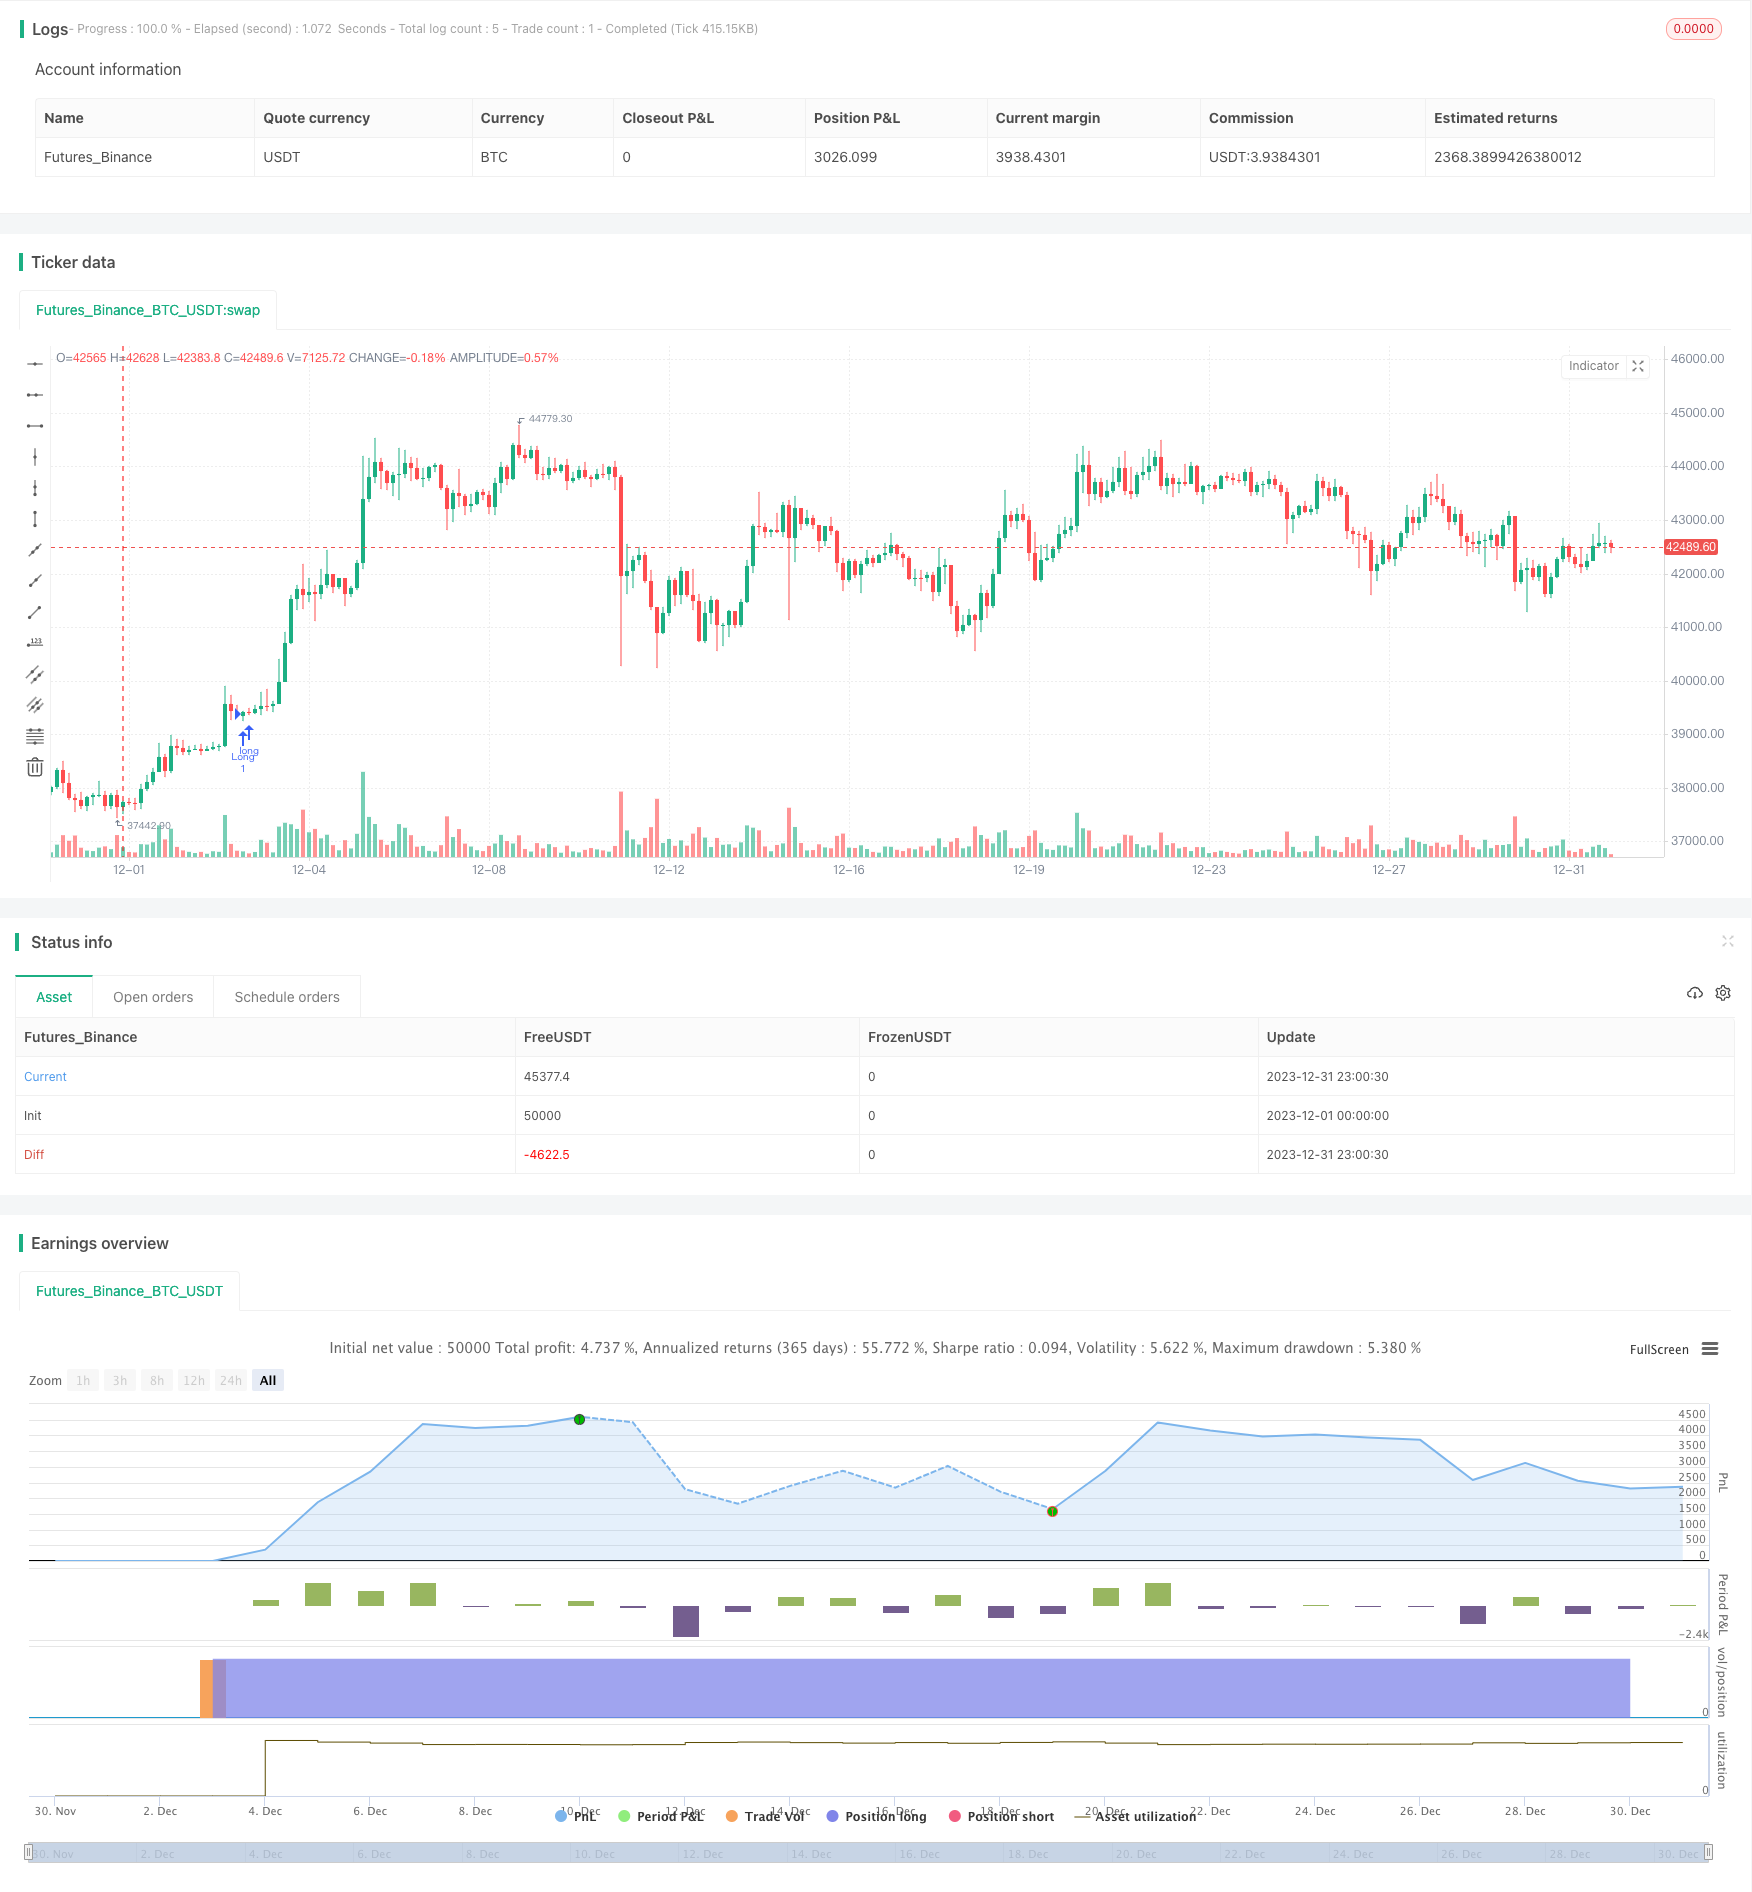
概述
动量趋势同步策略通过整合相对动量指数(RMI)和超级趋势指标的优势,实现了动量分析和趋势判断的有效结合。该策略同时关注价格变化趋势和市场动量水平,从更全面的角度判断市场走向。
策略原理
相对动量指数(RMI)
RMI是相对强度指数(RSI)的改进版本。它融合了价格变化的方向性、幅度等更多特征,能更准确判断市场动量。
RMI计算方法
RMI的计算方式是:先计算一定周期内的平均涨幅和平均跌幅。与RSI不同的是,RMI使用当日收盘价相对前一日收盘价的变化值,而不是简单的正增长和负增长。然后将平均涨幅除以平均跌幅,再进行归一化处理,使值落在0-100区间。
动量判断
本策略使用RMI与MFI的均值,与预设的正动量阈值和负动量阈值进行比较,判断当前市场动量水平,以此来决定建仓与平仓。
超级趋势指标
超级趋势指标基于更高时间周期计算,能提供对大趋势的判断。它会根据真实波幅ATR动态调整参数,从而有效识别趋势转折点。
本策略还加入了交易量加权均线VWMA,进一步增强了识别重要趋势转变的能力。
交易方向选择
本策略可以选择做多、做空或双向交易。这使得交易者可以根据自己的市场观点和风险偏好进行灵活调整。
策略优势分析
结合动量与趋势判断
相比单一使用动量指标或趋势指标的策略,本策略通过整合RMI和超级趋势指标的优势,实现了更准确的市场走势判断。
多时间周期分析
应用不同周期的RMI和超级趋势指标,使得对短期和长期趋势的把握更加到位。
实时止损策略
基于超级趋势的实时止损机制,可以有效控制单笔亏损。
交易方向灵活可调
做多、做空或双向交易的选择,使该策略可以适应不同的市场环境。
风险分析
参数优化难度大
RMI和超级趋势等参数的优化复杂,不当設定可能影响策略效果。
止损过于拉近可能导致过多止损
对小周期的市场波动过于敏感,会造成止损过于频繁的问题。
解决方法:适当放宽止损范围,或采用其他震荡型止损方式。
策略优化方向
多品种适应性优化
扩大适用的品种范围,识别不同品种的参数优化方向。使策略能够在更多市场中进行复制。
动态止损优化
加入动态止损方式,使止损线能更好跟踪当前波段,减少小震荡造成的过度止损。
增加过滤条件
结合更多指标判断作为过滤条件,避免在无明确信号的情况下建仓。
总结
该策略通过RMI和超级趋势指标的巧妙结合,实现了准确的市场状态判断。在控制风险方面也较为出色。通过深入优化,相信其在多品种和多周期上的表现会越来越出色。
/*backtest
start: 2023-12-01 00:00:00
end: 2023-12-31 23:59:59
period: 3h
basePeriod: 15m
exchanges: [{"eid":"Futures_Binance","currency":"BTC_USDT"}]
*/

// This source code is subject to the terms of the Mozilla Public License 2.0 at https://mozilla.org/MPL/2.0/
// @ presentTrading

//@version=5
strategy("RMI Trend Sync - Strategy [presentTrading]", shorttitle = "RMI Sync [presentTrading]", overlay=true )

// ---> Inputs --------------
// Add Button for Trading Direction
tradeDirection = input.string("Both", "Select Trading Direction", options=["Long", "Short", "Both"])

// Relative Momentum Index (RMI) Settings
Length = input.int(21, "RMI Length", group = "RMI Settings")
pmom = input.int(70, "Positive Momentum Threshold", group = "RMI Settings")
nmom = input.int(30, "Negative Momentum Threshold", group = "RMI Settings")
bandLength = input.int(30, "Band Length", group = "Momentum Settings")
rwmaLength = input.int(20, "RWMA Length", group = "Momentum Settings")


// Super Trend Settings
len = input.int(10, "Super Trend Length", minval=1, group="Super Trend Settings")
higherTf1 = input.timeframe('480', "Higher Time Frame", group="Super Trend Settings")
factor = input.float(3.5, "Super Trend Factor", step=.1, group="Super Trend Settings")
maSrc = input.string("WMA", "MA Source", options=["SMA", "EMA", "WMA", "RMA", "VWMA"], group="Super Trend Settings")
atr = request.security(syminfo.tickerid, higherTf1, ta.atr(len))
TfClose1 = request.security(syminfo.tickerid, higherTf1, close)

// Visual Settings
filleshow = input.bool(true, "Display Range MA", group = "Visual Settings")
bull = input.color(#00bcd4, "Bullish Color", group = "Visual Settings")
bear = input.color(#ff5252, "Bearish Color", group = "Visual Settings")

// Calculation of Bar Range
barRange = high - low

// RMI and MFI Calculations
upChange = ta.rma(math.max(ta.change(close), 0), Length)
downChange = ta.rma(-math.min(ta.change(close), 0), Length)
rsi = downChange == 0 ? 100 : upChange == 0 ? 0 : 100 - (100 / (1 + upChange / downChange))
mf = ta.mfi(hlc3, Length)
rsiMfi = math.avg(rsi, mf)

// Momentum Conditions
positiveMomentum = rsiMfi[1] < pmom and rsiMfi > pmom and rsiMfi > nmom and ta.change(ta.ema(close,5)) > 0
negativeMomentum = rsiMfi < nmom and ta.change(ta.ema(close,5)) < 0

// Momentum Status
bool positive = positiveMomentum ? true : negativeMomentum ? false : na
bool negative = negativeMomentum ? true : positiveMomentum ? false : na

// Band Calculation
calculateBand(len) =>
    math.min(ta.atr(len) * 0.3, close * (0.3/100)) * 4

band = calculateBand(bandLength)

// Range Weighted Moving Average (RWMA) Calculation
calculateRwma(range_, period) =>
    weight = range_ / math.sum(range_, period)
    sumWeightedClose = math.sum(close * weight, period)
    totalWeight = math.sum(weight, period)
    sumWeightedClose / totalWeight

rwma = calculateRwma(barRange, rwmaLength)
colour = positive ? bull : negative ? bear : na
rwmaAdjusted = positive ? rwma - band : negative ? rwma + band : na

max = rwma + band
min = rwma - band

longCondition       = positive and not positive[1]
shortCondition      = negative and not negative[1]

longExitCondition   = shortCondition
shortExitCondition  = longCondition

// Dynamic Trailing Stop Loss

vwma1 = switch maSrc
    "SMA"  => ta.sma(TfClose1*volume, len) / ta.sma(volume, len)
    "EMA"  => ta.ema(TfClose1*volume, len) / ta.ema(volume, len)
    "WMA"  => ta.wma(TfClose1*volume, len) / ta.wma(volume, len)

upperBand = vwma1 + factor * atr
lowerBand = vwma1 - factor * atr
prevLowerBand = nz(lowerBand[1])
prevUpperBand = nz(upperBand[1])
float superTrend = na
int direction = na
superTrend := direction == -1 ? lowerBand : upperBand

longTrailingStop = superTrend - atr * factor
shortTrailingStop = superTrend + atr * factor

// Strategy Order Execution
if (tradeDirection == "Long" or tradeDirection == "Both")
    strategy.entry("Long", strategy.long, when = longCondition)
    strategy.exit("Exit Long", "Long", when=longExitCondition, stop = longTrailingStop)
if (tradeDirection == "Short" or tradeDirection == "Both")
    strategy.entry("Short", strategy.short, when =shortCondition)
    strategy.exit("Exit Short", "Short", when=shortExitCondition, stop = shortTrailingStop)