概述
该策略是一个基于指数移动平均线(EMA)和移动平均线(MA)的交叉来产生交易信号的短线期权交易策略。当快速EMA上穿慢速MA时,产生买入信号;当快速EMA下穿慢速MA时,产生卖出信号。
策略原理
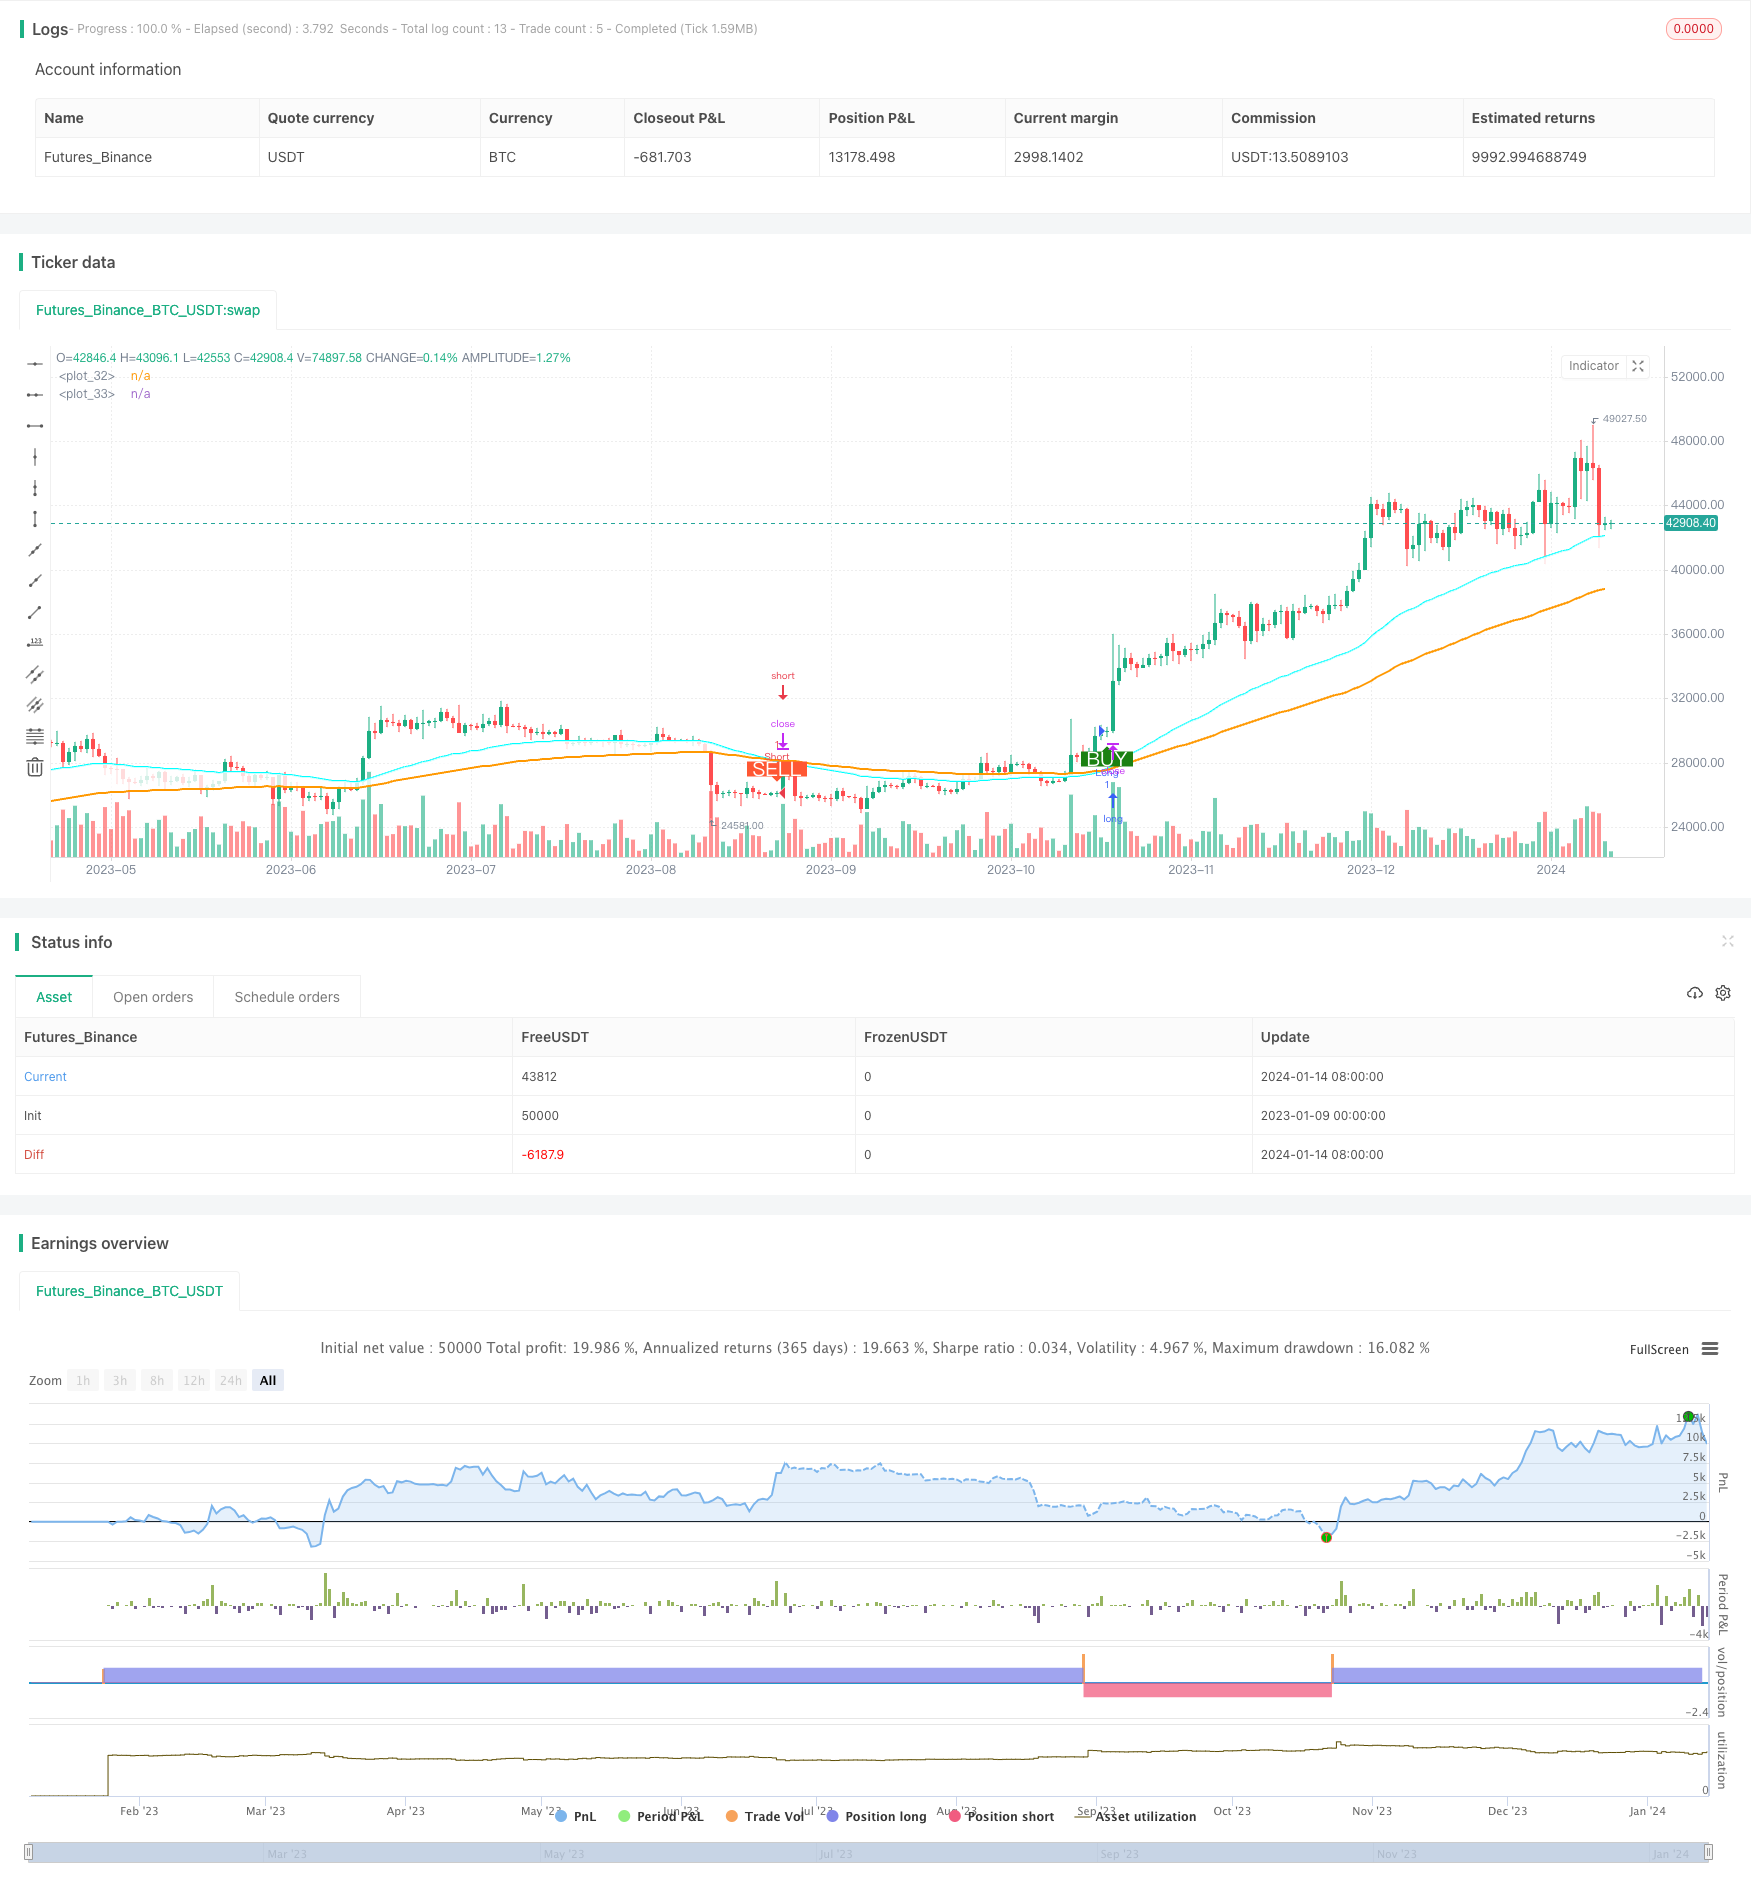
该策略使用两个不同参数的EMA和MA进行计算,分别是一个快速EMA和一个慢速MA。快速EMA参数设置为50,慢速MA参数设置为100。EMA指数移动平均线能更快地响应价格变动,而MA简单移动平均线响应价格变动更加缓慢。
当短期价格上涨加速时,快速EMA会先于慢速MA向上突破,产生买入信号。这表示市场短期看涨情绪增加,可以考虑买入或买入看涨期权。
当短期价格下跌加速时,快速EMA会先于慢速MA向下突破,产生卖出信号。这表示市场短期看跌情绪增加,可以考虑卖出或买入看跌期权。
通过快慢EMA/MA的交叉来判断短期价格变化趋势和市场情绪,实施适时的期权交易,能抓住较短线的价格波动获利。
优势分析
该策略有以下主要优势:
响应迅速,能及时抓住短线价格波动。通过快速EMA和慢速MA的交叉形成信号,快速发现短期涨跌变化。
实现简单,容易实施。仅需观察两条移动平均线的交叉情况,无需复杂计算。
灵活运用,可交易期权或正股。可根据信号买入看涨期权、卖出看跌期权,也可以直接做多或做空正股。
可控风险,止损机制明确。可 preset 止损点,控制单笔损失。
风险分析
该策略也存在一些风险需要注意:
可能出现错误信号和震荡行情的风险。快慢EMA/MA可能多次交叉摆动,令交易频繁开仓平仓,增加交易成本和实施难度。可适当放宽止损幅度,避免过频交易。
大盘持续疲软时容易产生亏损。策略以抓短线为主,遇持续下跌行情,止损可能频繁触发。这时可考虑暂停使用策略,转至观望状态,等待大盘回暖。
需关注重大事件造成的股价异常波动的风险。重大事件发生时,股价可能出现异常波动,导致止损被突破或产生巨额亏损。这需要充分考量是否在该阶段使用策略交易。
优化方向
该策略可从以下几个方向进行优化:
基于波动率的止损调整。采用动态止损,根据股价波动率实时调整止损幅度。降低止损被冲击的概率。
整合多个时间周期EMA。如加入日线及周线EMA,判断大周期趋势,避免逆势交易。
RSI指标过滤。加入RSI指标判断超买超卖区,过滤掉部分噪音信号。
机器学习波动率预测。采用LSTM等深度学习模型,预测股价波动率和风险,动态调整持仓和止损。
总结
该短线EMA/MA交叉策略,通过快速EMA和慢速MA的交叉来判断价格短期趋势和市场情绪,可快速响应价格变化,及时抓取短线交易机会。策略实施简单,但也存在一些噪音信号和持续亏损的风险。可通过止损优化、整合多时间周期、RSI过滤以及机器学习等方式进行升级,在控制风险前提下,提高策略收益。
/*backtest
start: 2023-01-09 00:00:00
end: 2024-01-15 00:00:00
period: 1d
basePeriod: 1h
exchanges: [{"eid":"Futures_Binance","currency":"BTC_USDT"}]
*/

//@version=4
strategy("Backtest single EMA cross", overlay=true)

qty = input(100000, "Buy quantity")

testStartYear = input(2019, "Backtest Start Year")
testStartMonth = input(1, "Backtest Start Month")
testStartDay = input(1, "Backtest Start Day")
testStartHour = input(0, "Backtest Start Hour")
testStartMin = input(0, "Backtest Start Minute")
testPeriodStart = timestamp(testStartYear, testStartMonth, testStartDay, testStartHour, testStartMin)
testStopYear = input(2099, "Backtest Stop Year")
testStopMonth = input(1, "Backtest Stop Month")
testStopDay = input(30, "Backtest Stop Day")
testPeriodStop = timestamp(testStopYear, testStopMonth, testStopDay, 0, 0)
testPeriodBackground = input(title="Color Background?", type=input.bool, defval=true)
testPeriodBackgroundColor = testPeriodBackground and time >= testPeriodStart and time <= testPeriodStop ?
   #00FF00 : na
testPeriod() => true


ema1 = input(50, title="Select EMA 1")
ema2 = input(100, title="Select EMA 2")

expo = ema(close, ema1)
ma = ema(close, ema2)

avg_1 = avg(expo, ma)
s2 = cross(expo, ma) ? avg_1 : na
//plot(s2, style=plot.style_line, linewidth=3, color=color.red, transp=0)

p1 = plot(expo, color=#00FFFF, linewidth=2, transp=0)
p2 = plot(ma, color=color.orange, linewidth=2, transp=0)
fill(p1, p2, color=color.white, transp=80)


longCondition = crossover(expo, ma)

shortCondition = crossunder(expo, ma)

exitlongCondition = crossunder(expo, ma)

exitshortCondition = crossover(expo, ma)


if testPeriod()
    strategy.entry("Long", strategy.long, when=longCondition)
    strategy.entry("Short", strategy.short, when=shortCondition)

plotshape(longCondition, title = "Buy Signal", text ="BUY", textcolor = #FFFFFF , style=shape.labelup, size = size.normal, location=location.belowbar, color = #1B8112, transp = 0)
plotshape(shortCondition, title = "Sell Signal", text ="SELL", textcolor = #FFFFFF, style=shape.labeldown, size = size.normal, location=location.abovebar, color = #FF5733, transp = 0)