概述
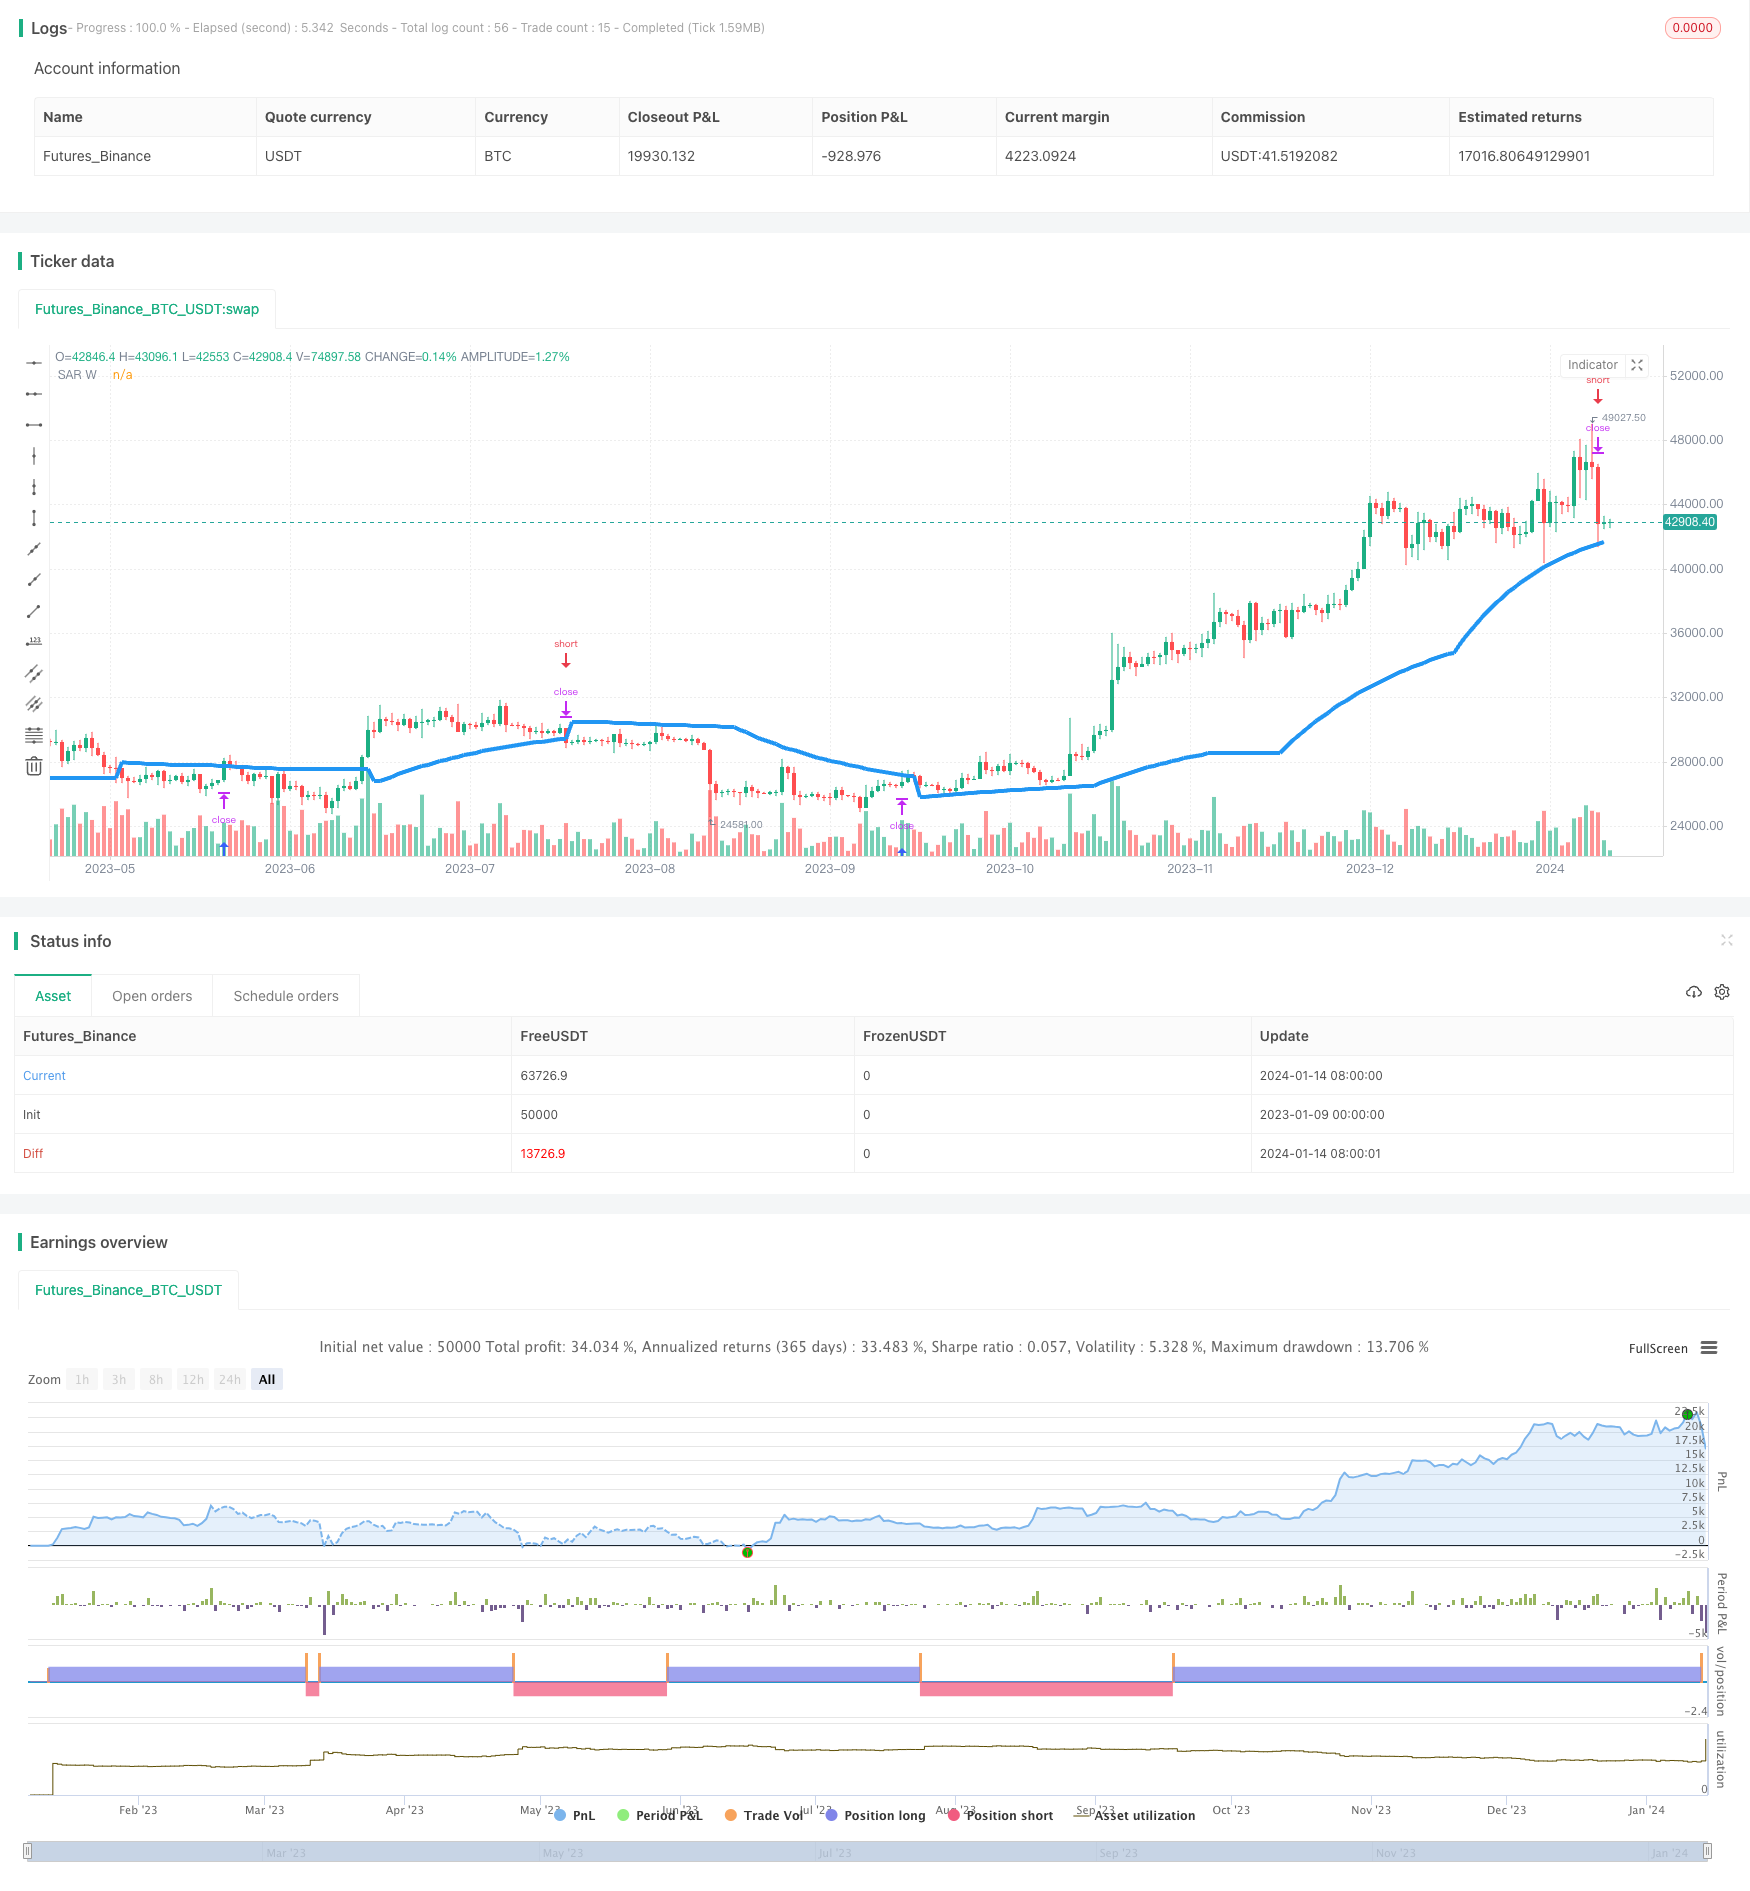
该策略是基于SAR指标在不同时间周期进行交替操作的交易策略。策略会在15分钟,日线,周线和月线时间框架下分别计算SAR指标,并在周线时间框架下进行交易操作。当周线SAR指标上穿最高价时做多,下穿最低价时做空。
策略原理
SAR指标计算
SAR指标代表抛物线转向指标(Parabolic SAR),它通过计算当前价格与历史价格的关系来判断市场的趋势方向,当价格突破SAR点时,表示趋势发生反转。
本策略在15分钟,日线,周线和月线时间框架下分别计算SAR值。计算公式为:
SAR = SAR前值 + 加速因子(最高价 - SAR前值) # 多头趋势
SAR = SAR前值 + 加速因子(最低价 - SAR前值) # 空头趋势
其中,加速因子初值设置为0.02,随着趋势的延续会逐步增加至最大0.2。
交易策略
策略在周线时间框架下发出交易信号。当周线SAR上穿最高价时做多,设置止损为SAR值。当SAR下穿最低价时做空,设置止损为SAR值。
该策略通过在更高级别的时间框架判断趋势,设置更精确的止损位置,从而获利更高效。
优势分析
- 利用SAR判断趋势反转点,精确定位入场点位
- 在高级时间框架操作,跟大趋势运行
- 止损点紧贴SAR,有效控制风险
风险及解决方案
- SAR指标存在滞后,可能出现超过止损点后再反转的情况。解决方法是适当放宽止损距离。
- 趋势巨大时,SAR的加速FACTOR会逐步放大,出现放量突破的可能。解决方法是限制FACTOR最大值。
- 在高级时间框架下,周期过长回撤时间久。可通过降低仓位规避风险。
优化思路
- 优化入场条件,例如结合其他指标过滤信号
- 优化止损策略,例如移动止损、区间止损等
- 优化仓位管理,例如固定份额、动态调整等
- 在更高级别的时间框架操作,例如季度线、年线
- 结合机器学习算法动态优化参数
总结
该策略整体思路清晰,通过在高时间框架判断趋势,可有效跟随大方向操作。同时SAR指标较为精确地定位趋势转折点,也使止损风险控制到较小水平。后续可从入场条件、止损策略、仓位管理等方面进行优化,使策略更加稳定高效。
策略源码
/*backtest
start: 2023-01-09 00:00:00
end: 2024-01-15 00:00:00
period: 1d
basePeriod: 1h
exchanges: [{"eid":"Futures_Binance","currency":"BTC_USDT"}]
*/

//@version=2
strategy ("SAR alternating timeframe", overlay=true)

//resolution
res1=input("15", title="Resolution")
res2=input("D", title="Resolution")
res3=input("W", title="Resolution")
res4=input("M", title="Resolution")

//output functions
out = sar(0.02,0.02,0.2)

// request.security
SAR1 = request.security(syminfo.tickerid, res1, out)
SAR2 = request.security(syminfo.tickerid, res2, out)
SAR3 = request.security(syminfo.tickerid, res3, out)
SAR4 = request.security(syminfo.tickerid, res4, out)

//Plots
//plot(SAR1 , title="SAR 15", color = red, linewidth = 2)
//plot(SAR2 , title="SAR D", color = green, linewidth = 3)
plot(SAR3 , title="SAR W", color =blue, linewidth = 4)
//plot(SAR4 , title="SAR W", color =purple, linewidth = 5))


/////////////////////////////////////////////////////////////////////
//trade
if (SAR3 >= high)
    strategy.entry("ParLE", strategy.long, stop=SAR3, comment="ParLE")
else
    strategy.cancel("ParLE")

if (SAR3 <= low)
    strategy.entry("ParSE", strategy.short, stop=SAR3, comment="ParSE")
else
    strategy.cancel("ParSE")