概述
该策略命名为“基于价格通道的突破策略”,其主要思想是利用价格通道来判断市场趋势和方向,在价格突破通道时建立头寸。它会首先画出价格的通道范围,然后判断K线是否出现连续两根红色或绿色K线,如果最后一根K线突破通道半幅以上并收盘于通道之外,则产生买入或卖出信号。
策略原理
该策略通过 highest() 和 lowest() 函数计算过去一定周期内的最高价和最低价,以此确定价格通道的上下轨。通道的中线被定义为上下轨的平均值。然后计算K线实体的大小,并通过SMA平滑,判断最后一个K线的实体是否大于平均实体的一半。另外还判断最后两根K线是否同向(连续两根红或两根绿)。在这些条件满足时,即产生买入/卖出信号,并在价格回落到通道方向时平仓。
优势分析
这是一个利用价格通道判断趋势的突破策略。它有以下几点优势:
利用价格通道判断整体趋势方向,可以有效过滤市场噪音。
连续两根K线同向突破通道,说明动量较强,突破成功率较高。
判断K线实体超过平均实体一半,可以避免被假突破欺骗。
策略逻辑简单易懂,容易实施。
可自定义参数如通道周期、交易品种、交易时间等,适应性强。
风险分析
该策略也存在一些潜在风险:
突破失败的概率仍存在,可能造成损失。
行情剧烈波动时,通道判断可能失效。
缺乏止损机制,无法有效控制损失。
简单的交易规则,存在过拟合风险。
无法适应更加复杂的市场环境。
对应解决方法如下:
优化参数,提高突破成功率。
加入波动率指标,避开震荡行情。
增加移动止损设置。
进行复杂度测试,检查过拟合。
增加机器学习算法,提高策略的适应性。
优化方向
该策略的优化方向主要有:
增加止损机制,更好地控制风险。可以设置价格回落止损,也可以利用ATR等指标设置移动止损。
优化参数,如通道周期、突破幅度参数等。可以通过遗传算法、网格搜索等方法寻找最优参数。
增加过滤条件,提高突破的确定性。例如可以结合交易量来确认突破。
添加机器学习模型,利用更多数据提高策略的预测能力和适应性。例如LSTM等深度学习可以捕捉更复杂的行情模式。
进行组合优化,将不同类型的突破策略组合起来,实现正交化,减少相似度。
总结
该策略整体来说是一个基于价格通道判断趋势,发现突破信号的量化策略。它有判断趋势、确认突破的优点,但也存在一定的假突破风险。我们可以通过参数优化、止损设置、增加条件过滤等方法来改进策略,降低风险。同时加入机器学习模型也可以进一步增强策略的预测能力。总的来说,这是一个有潜力的量化策略思路,值得我们深入研究与改进。
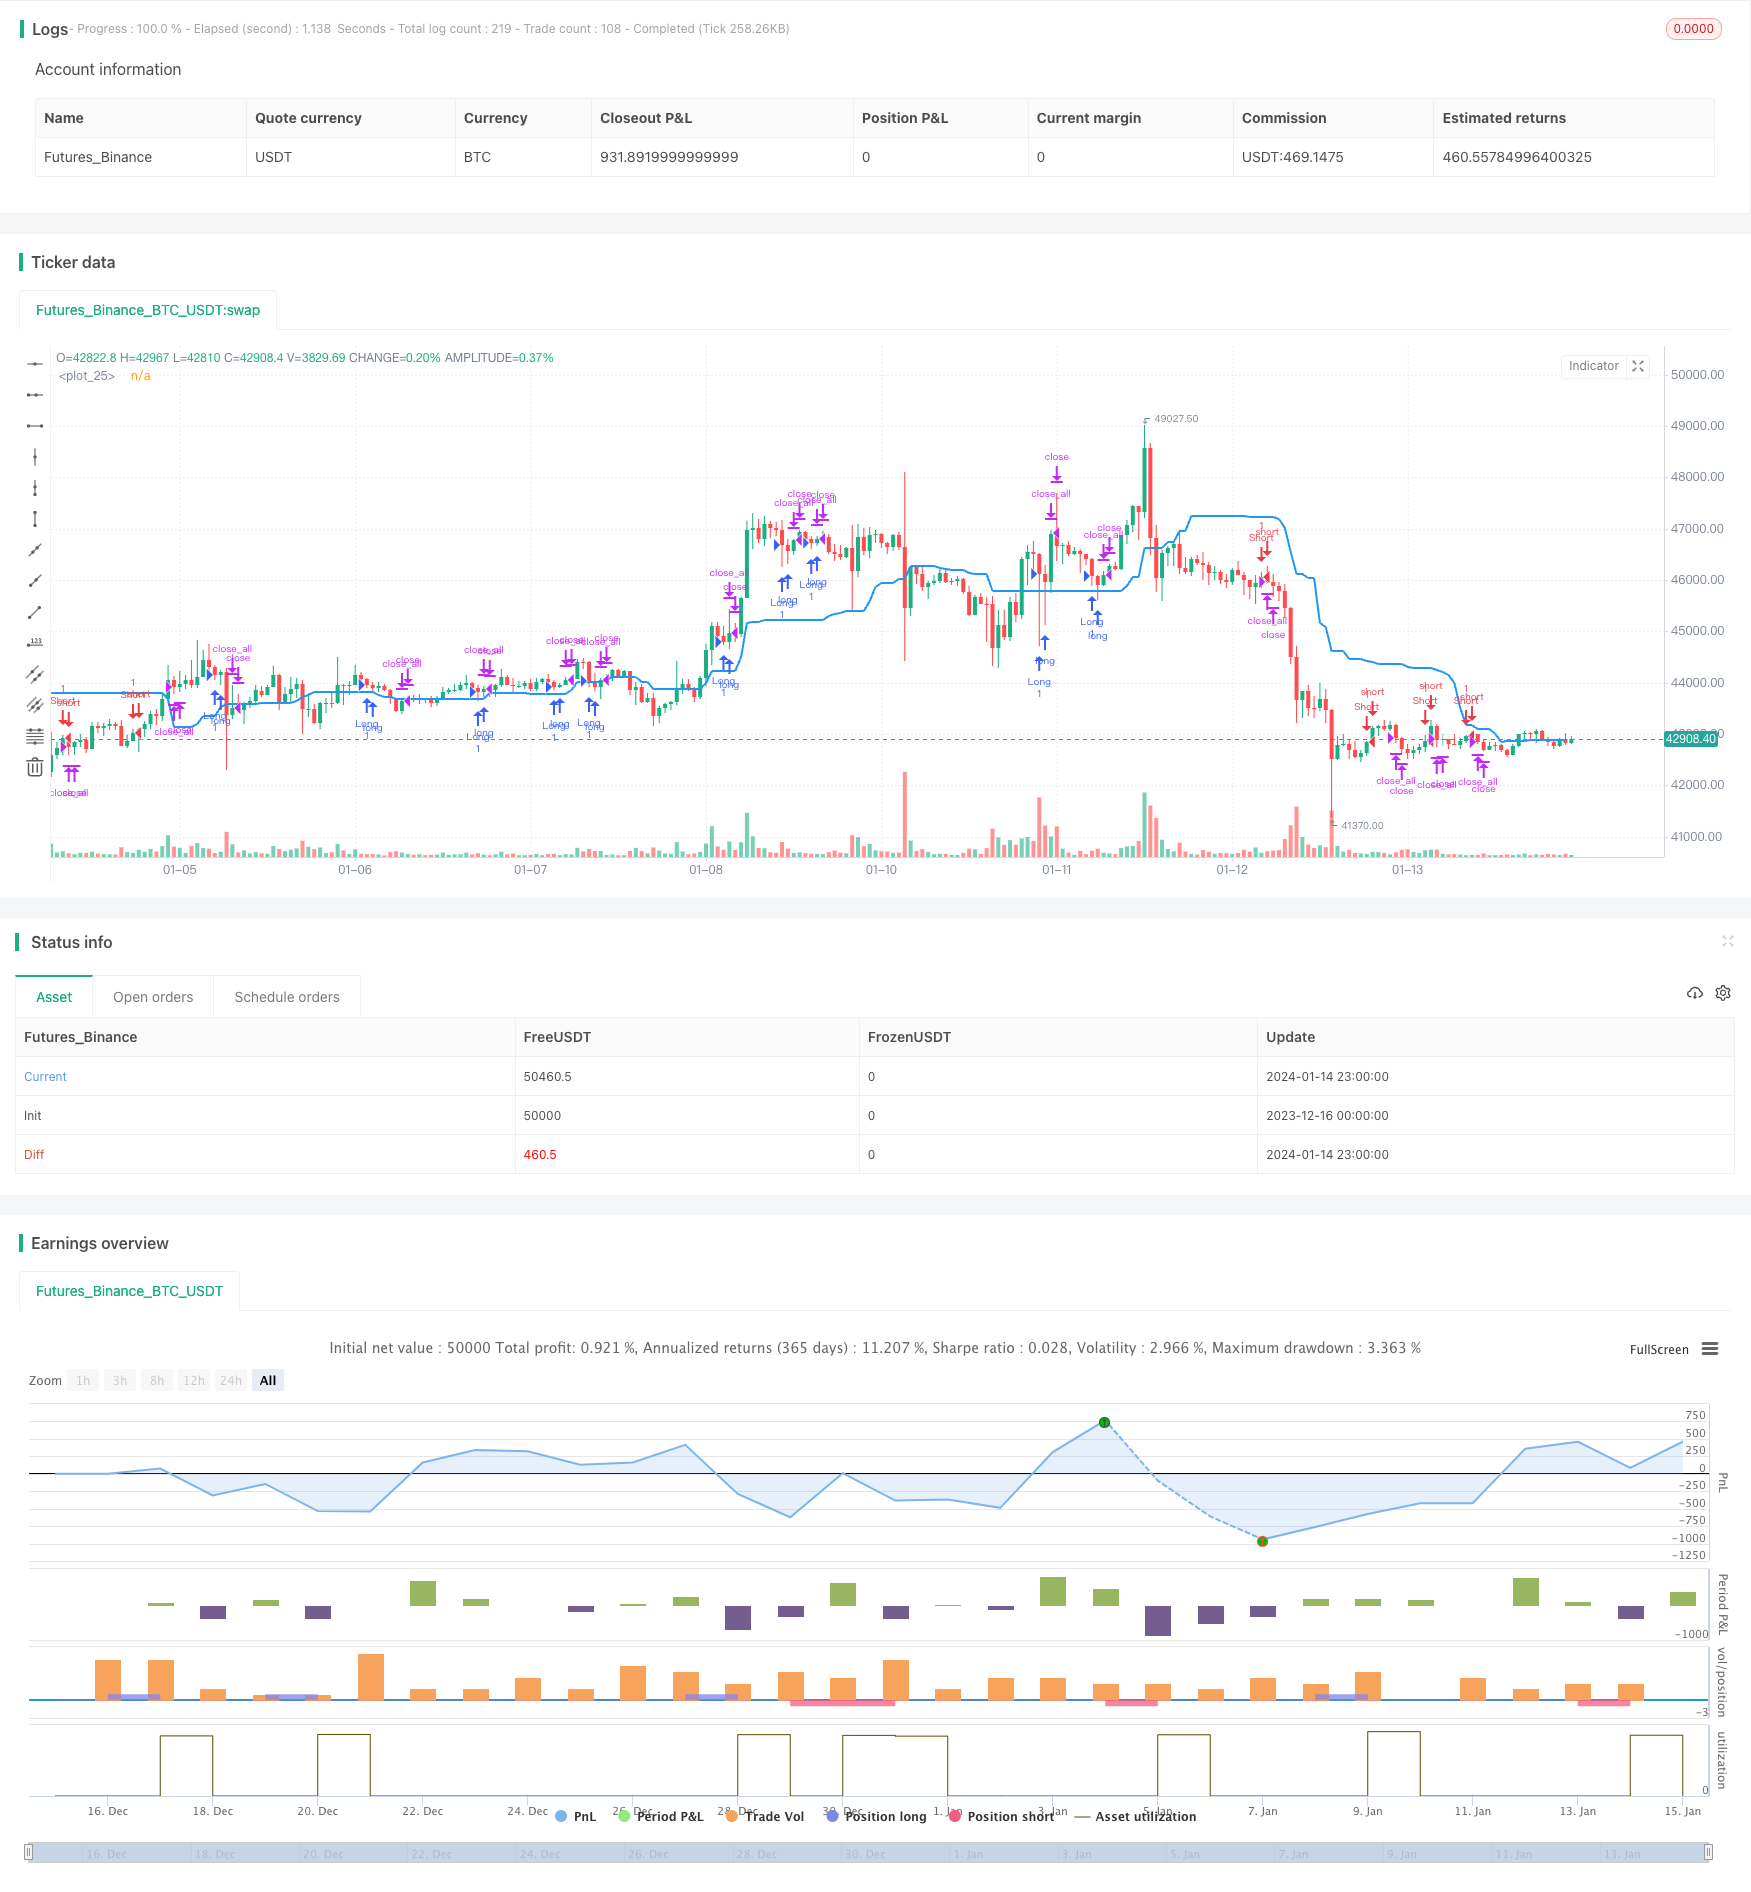
/*backtest
start: 2023-12-16 00:00:00
end: 2024-01-15 00:00:00
period: 1h
basePeriod: 15m
exchanges: [{"eid":"Futures_Binance","currency":"BTC_USDT"}]
*/

//Noro
//2018

//@version=2
strategy(title = "Noro's Price Channel Strategy v1.0", shorttitle = "Price Channel str 1.0", overlay=true, default_qty_type = strategy.percent_of_equity, default_qty_value = 100, pyramiding = 0)

//Settings
needlong = input(true, defval = true, title = "Long")
needshort = input(true, defval = true, title = "Short")
pch = input(30, defval = 30, minval = 2, maxval = 200, title = "Price Channel")
showcl = input(true, defval = true, title = "Show center-line")
fromyear = input(1900, defval = 1900, minval = 1900, maxval = 2100, title = "From Year")
toyear = input(2100, defval = 2100, minval = 1900, maxval = 2100, title = "To Year")
frommonth = input(01, defval = 01, minval = 01, maxval = 12, title = "From Month")
tomonth = input(12, defval = 12, minval = 01, maxval = 12, title = "To Month")
fromday = input(01, defval = 01, minval = 01, maxval = 31, title = "From day")
today = input(31, defval = 31, minval = 01, maxval = 31, title = "To day")
src = close

//Price channel
lasthigh = highest(src, pch)
lastlow = lowest(src, pch)
center = (lasthigh + lastlow) / 2
col = showcl ? blue : na
plot(center, color = col, linewidth = 2)

//Bars
bar = close > open ? 1 : close < open ? -1 : 0
rbars = sma(bar, 2) == -1
gbars = sma(bar, 2) == 1

//Signals
body = abs(close - open)
abody = sma(body, 10)
up = rbars and close > center and body > abody / 2
dn = gbars and close < center and body > abody / 2
exit = ((strategy.position_size > 0 and close > open) or (strategy.position_size < 0 and close < open)) and body > abody / 2

//Trading
if up
    if strategy.position_size < 0
        strategy.close_all()

    strategy.entry("Long", strategy.long, needlong == false ? 0 : na)

if dn
    if strategy.position_size > 0
        strategy.close_all()

    strategy.entry("Short", strategy.short, needshort == false ? 0 : na)

if exit
    strategy.close_all()