概述
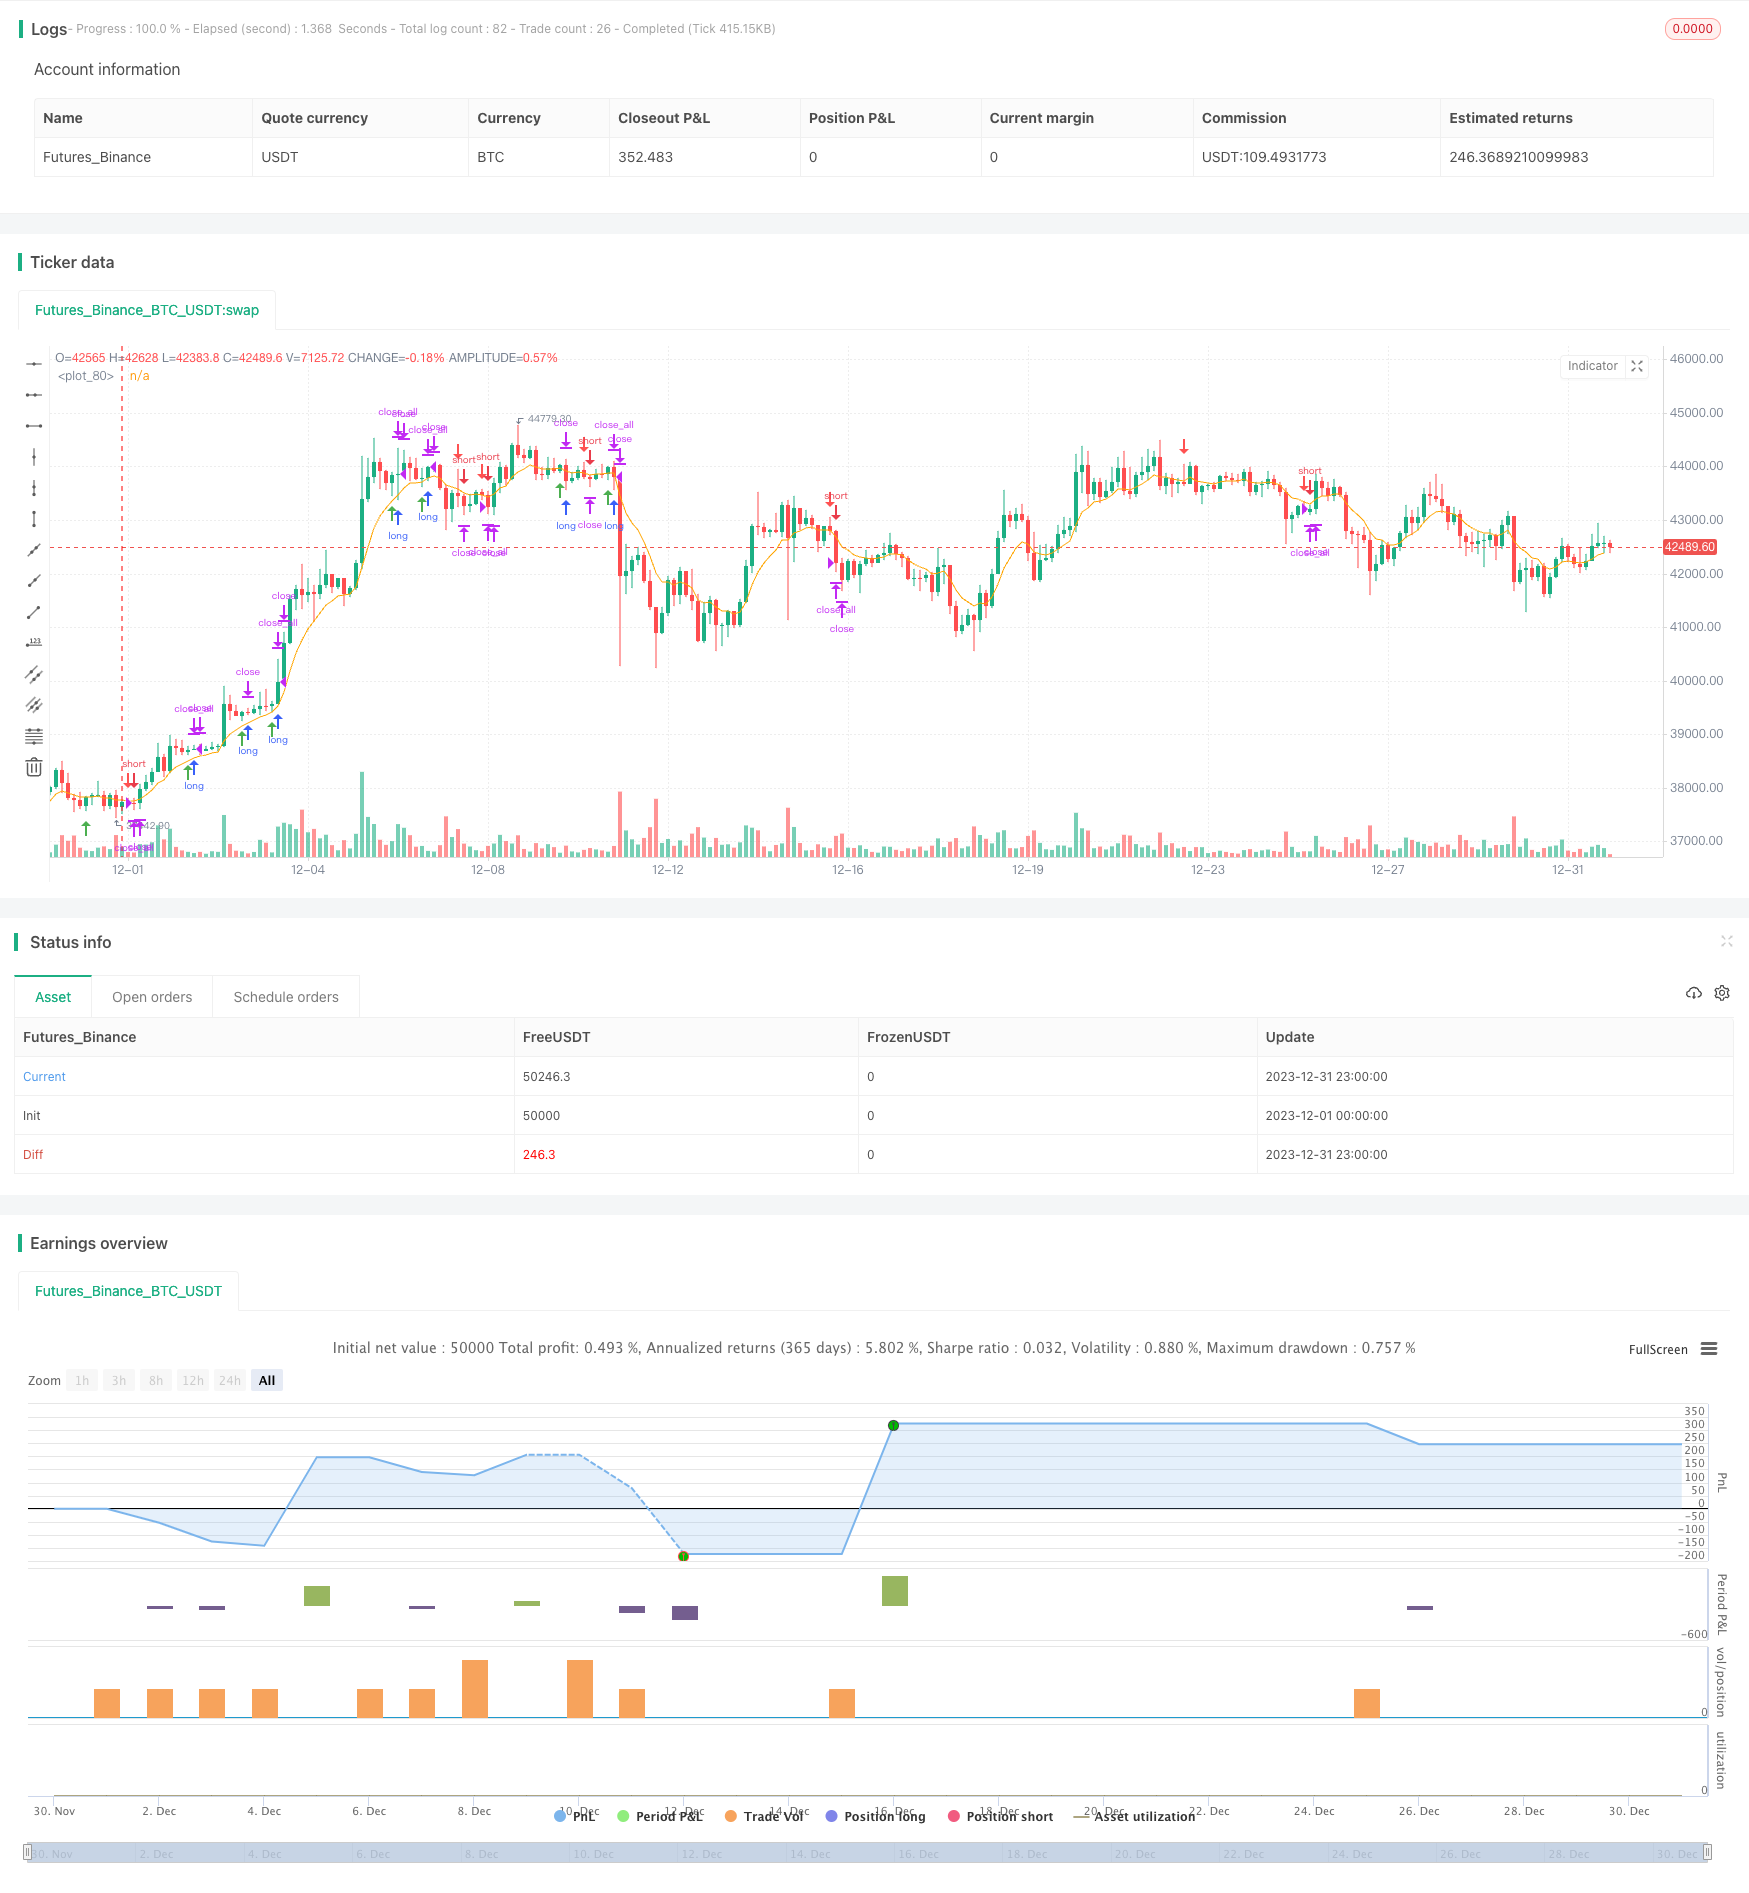
趋势追踪反转策略是一种基于15分钟NQ期货的短期趋势交易策略。它通过趋势滤波和反转形态识别来寻找交易机会。该策略简单而有效,适合短线活跃型交易者。
策略原理
该策略主要基于以下几点原理运作:
使用8周期的EMA作为主要的趋势过滤指标,EMA上方看多,EMA下方看空。
识别特定的K线反转形态作为入场信号,包括长阳线后短阴线看多信号和长阴线后短阳线看空信号,这些形态提示趋势可能开始反转。
入场点设置为反转K线的高点或低点附近,止损点设置为反转K线本身的高低点,实现高效的风险回报比。
利用K线实体关系判断反转信号的有效性,如阴线开盘价高于上一根K线实体,实体完全包含等规则来过滤噪音。
只在特定的交易时段运作策略,避开市场主要合约换月等特殊时间段,防止异常行情导致不必要的损失。
优势分析
该策略具有以下几点主要优势:
策略信号简单有效,容易掌握实施。
基于趋势和反转判断,避免被黄牛市场和熊市场双重杀伤。
风险控制到位,止损设置合理,有利于资金管理。
数据需求量小,适合各类软件和平台使用。
交易频率较高,适合热衷短线活跃型交易的投资者。
风险及对策
该策略也存在一些风险,主要问题在于:
反转形态机会不足,信号较少。可以适当放宽反转判断规则。
假突破问题时有发生。可以加入更多过滤指标进行联合判断。
夜盘和非主流时间存在不稳定性。可以设置只在美国交易时段运作。
参数优化空间有限。可以尝试机器学习等技术寻找更优参数。
优化方向
该策略还有一定的优化空间,主要方向包括:
测试更长周期的EMA参数,改进趋势判断。
增加股票大盘指数作为额外的趋势过滤指标。
利用机器学习等技术自动优化入场和止损点位。
增加基于波动率的仓位和止损动态调整机制。
尝试多品种套利,进一步分散单一品种的系统性风险。
总结
趋势追踪反转策略整体而言是一个非常实用的短线策略思路,简单参数少,实操容易上手,0014能很好控制个人风险,适合炒股论坛的活跃型短线交易者。该策略有一定的优化空间,投入一定研发精力可以使其甚至适合中长线资金进行程序化运作,具有很好的发展潜力。
/*backtest
start: 2023-12-01 00:00:00
end: 2023-12-31 23:59:59
period: 3h
basePeriod: 15m
exchanges: [{"eid":"Futures_Binance","currency":"BTC_USDT"}]
*/

// This Pine Script™ code is subject to the terms of the Mozilla Public License 2.0 at https://mozilla.org/MPL/2.0/
// © bdrex95

//@version=5

// Rob Reversal Strategy - Official
// Using Rob Reversal Indicator: Original
// Description
// This indicator is based on the strategy created by Trader Rob on the NQ 15m chart.
//
// Timeframe for trading is 8:30am-1:15pm Central.
//
// Above the EMA line, look for a long position. You will have a short candle, then a long candle that opens below the short candle. It will have a lower high and a lower low. Once the long candle closes, your entry will be 1 tick above the wick (green line) and stop loss will be at the bottom of the bottom wick (red line).
//
// Below the EMA line, look for a short position. You will have a long candle, then a short candle that opens above the long candle. It will have a higher high and a higher low. Once the short candle closes, your entry will be 1 tick below the wick (green line) and stop loss will be at the top of the top wick (red line).
//

strategy("Trader Rob Reversal Strategy NQ 15min", shorttitle="Official Rob Rev Strat", overlay=true)


//--- Session Input ---
sess = input(defval = "0930-1415", title="Trading Session")
t = time(timeframe.period, sess)
sessionOpen = na(t) ? false : true

flat_time = input(defval = "1515-1558", title="Close All Open Trades")
ft = time(timeframe.period, flat_time)
flatOpen = na(ft) ? false : true


// Calculate start/end date and time condition
startDate = input(timestamp('2018-12-24T00:00:00'),group = "ALL STRATEGY SETTINGS BELOW")
finishDate = input(timestamp('2029-02-26T00:00:00'),group = "ALL STRATEGY SETTINGS BELOW")
time_cond = true


emaColor = input.color(color.orange, title="EMA Color")
emaLength = input.int(8, title="EMA Length")


emaInd = ta.ema(close, emaLength)


rr = input(1.0,"Enter RR",group = "TP/SL CONDITION INPUTS HERE")


sellShapeInput = input.string("Arrow", title="Sell Entry Shape", options=["Arrow", "Triangle"])
buyShapeInput = input.string("Arrow", title="Buy Entry Shape", options=["Arrow", "Triangle"])


sellShapeOption = switch sellShapeInput
    "Arrow" => shape.arrowdown
    "Triangle" => shape.triangledown

buyShapeOption = switch buyShapeInput
    "Arrow" => shape.arrowup
    "Triangle" => shape.triangleup


O = open
C = close
H = high
L = low


sellEntry = (C[1] > O[1]) and (C < O) and (H[1] < H) and (C < H[1]) and (C > L[1]) and (L > L[1]) and (C < emaInd) and sessionOpen and time_cond
buyEntry = (C[1] < O[1]) and (C > O) and (H[1] > H) and (L[1] > L) and (C < H[1]) and (C > L[1]) and (C > emaInd) and sessionOpen and time_cond


sellEntry_index = ta.valuewhen(sellEntry,bar_index,0)
sellEntry_hi = ta.valuewhen(sellEntry,high,0)
sellEntry_low = ta.valuewhen(sellEntry,low,0)
buyEntry_index = ta.valuewhen(buyEntry,bar_index,0)
buyEntry_hi = ta.valuewhen(buyEntry,high,0)
buyEntry_lo = ta.valuewhen(buyEntry,low,0)


plotshape(buyEntry, color = color.green, location = location.belowbar, style = buyShapeOption, size = size.small)
plotshape(sellEntry, color = color.red, location = location.abovebar, style = sellShapeOption, size = size.small)
plot(emaInd, color=emaColor)


// Risk Management
entry_price_long = (buyEntry_hi + syminfo.mintick)
entry_price_short = (sellEntry_low - syminfo.mintick)
long_sl_price = (buyEntry_lo-syminfo.mintick)
short_sl_price = (sellEntry_hi + syminfo.mintick)
long_tp_price = ((entry_price_long - long_sl_price)*rr) + entry_price_long
short_tp_price = entry_price_short - ((short_sl_price - entry_price_short)*rr)


long_sl_ticks = (entry_price_long - long_sl_price) / syminfo.mintick
short_sl_ticks = (short_sl_price - entry_price_short) / syminfo.mintick


long_tp_ticks = (long_tp_price - entry_price_long) / syminfo.mintick
short_tp_ticks = (entry_price_short - short_tp_price) / syminfo.mintick


// Positions
if (buyEntry)
    strategy.entry("Long", strategy.long,stop = H + syminfo.mintick)
if strategy.position_size > 0
    strategy.exit("Long Ex","Long", loss = long_sl_ticks, profit = long_tp_ticks, comment_loss = "SL Long", comment_profit = "TP Long")


if (sellEntry)
    strategy.entry("Short", strategy.short,stop = L - syminfo.mintick)
if strategy.position_size < 0
    strategy.exit("Short Ex","Short",loss = short_sl_ticks, profit = short_tp_ticks, comment_loss = "SL Short", comment_profit = "TP Short")


// Cancel order if close beyond ema
if (C < emaInd)
    strategy.cancel("Long")


if (C > emaInd)
    strategy.cancel("Short")


// Go flat at close (for futures funded account)
if strategy.position_size > 0 and flatOpen
    strategy.close_all(comment = "EOD Flat")
if strategy.position_size < 0 and flatOpen
    strategy.close_all(comment = "EOD Flat")

//END